Intro
Unlock the power of statistical analysis in Excel with the Central Limit Theorem (CLT). Learn how to apply CLT in 5 practical ways to enhance your data analysis skills. Master techniques for calculating probabilities, estimating population means, and visualizing distributions with ease. Boost your Excel skills and make informed decisions with CLT.
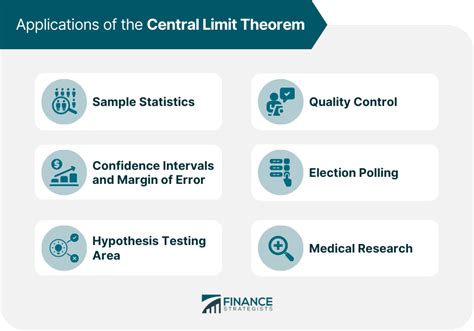
In the world of statistics and data analysis, the Central Limit Theorem (CLT) is a fundamental concept that plays a crucial role in understanding the behavior of large datasets. While it may seem like a complex and abstract idea, the CLT has numerous practical applications, especially when working with Excel. In this article, we will explore five ways to apply the Central Limit Theorem in Excel, making it easier to analyze and interpret large datasets.

Understanding the Central Limit Theorem
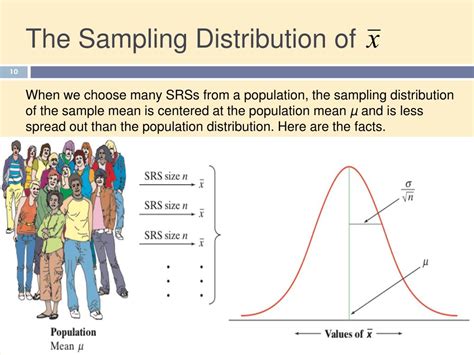
Before we dive into the applications, let's take a brief look at what the Central Limit Theorem is all about. The CLT states that, given a large enough sample size, the distribution of the sample means will be approximately normal, even if the underlying population distribution is not normal. This theorem has far-reaching implications in statistics, as it allows us to make inferences about a population based on a sample of data.
Assumptions of the Central Limit Theorem
To apply the CLT in Excel, it's essential to understand the assumptions that underlie this theorem. These assumptions include:
- The sample must be randomly selected from the population.
- The sample size must be sufficiently large (typically n > 30).
- The population must have a finite variance.

1. Sampling Distribution of the Mean
One of the most common applications of the CLT in Excel is to create a sampling distribution of the mean. This involves taking multiple random samples from a population, calculating the mean of each sample, and then plotting the distribution of these sample means.
Using Excel, you can create a sampling distribution of the mean by:
- Using the
RAND()function to generate random samples from a population. - Calculating the mean of each sample using the
AVERAGE()function. - Plotting the distribution of sample means using a histogram or density plot.

2. Confidence Intervals
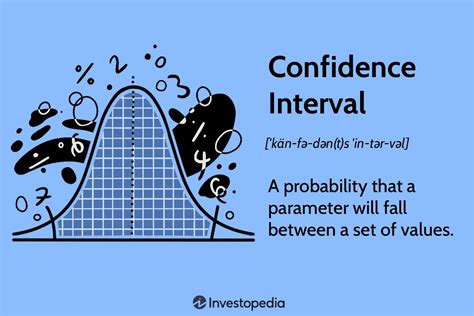
Another application of the CLT in Excel is to construct confidence intervals. A confidence interval provides a range of values within which a population parameter is likely to lie. Using the CLT, you can create confidence intervals for a population mean.
In Excel, you can create a confidence interval by:
- Using the
CONFIDENCE.NORM()function to calculate the margin of error. - Calculating the sample mean using the
AVERAGE()function. - Plotting the confidence interval using a range or error bar chart.

3. Hypothesis Testing
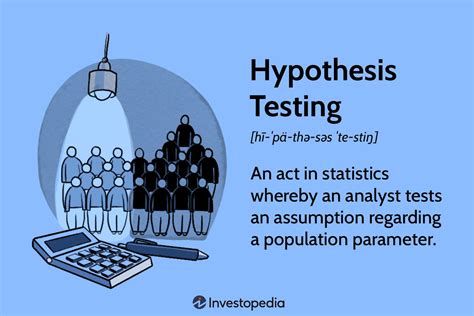
The CLT is also essential in hypothesis testing, where you test a null hypothesis about a population parameter. In Excel, you can use the CLT to test hypotheses about a population mean.
Using Excel, you can perform hypothesis testing by:
- Using the
T.TEST()function to calculate the t-statistic. - Calculating the sample mean using the
AVERAGE()function. - Plotting the results using a scatter plot or bar chart.

4. Predictive Modeling
The CLT can also be applied in predictive modeling, where you use historical data to forecast future outcomes. In Excel, you can use the CLT to create predictive models that account for the uncertainty in the data.
Using Excel, you can create predictive models by:
- Using the
FORECAST.ETS()function to create a forecasting model. - Calculating the sample mean using the
AVERAGE()function. - Plotting the results using a time series or line chart.

5. Simulation Analysis
Finally, the CLT can be applied in simulation analysis, where you use random sampling to model complex systems or processes. In Excel, you can use the CLT to perform simulation analysis and estimate the behavior of a system or process.
Using Excel, you can perform simulation analysis by:
- Using the
RAND()function to generate random samples from a population. - Calculating the sample mean using the
AVERAGE()function. - Plotting the results using a histogram or density plot.

Gallery of Central Limit Theorem Applications
Central Limit Theorem Image Gallery


Conclusion
In conclusion, the Central Limit Theorem is a powerful tool in statistics and data analysis, and its applications in Excel are numerous. By understanding the assumptions and principles of the CLT, you can apply it to a wide range of problems, from sampling distributions to predictive modeling. Whether you're a data analyst, statistician, or simply looking to improve your analytical skills, mastering the CLT in Excel can take your analysis to the next level.
We hope this article has provided you with a deeper understanding of the Central Limit Theorem and its applications in Excel. If you have any questions or comments, please feel free to share them below.
