In statistical analysis, confidence intervals are used to estimate the population parameter from a sample of data. Excel, being a popular data analysis tool, offers various methods to plot confidence intervals. Here are 5 ways to plot confidence intervals in Excel.
Understanding Confidence Intervals
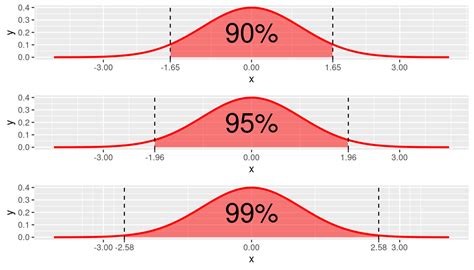
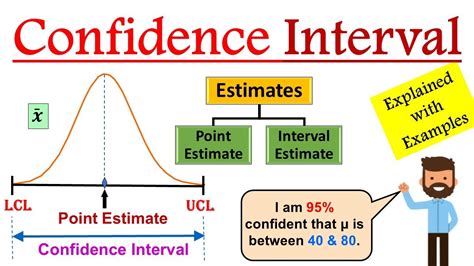
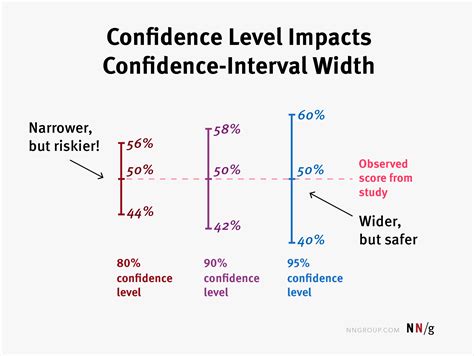
Before we dive into the methods, let's understand what confidence intervals are. A confidence interval is a range of values within which the population parameter is likely to lie. It's a measure of uncertainty, and it's used to estimate the population mean, proportion, or other parameters. The interval is usually expressed as a range, e.g., "We are 95% confident that the population mean lies between 10.2 and 12.1."
Method 1: Using the CONFIDENCE Function
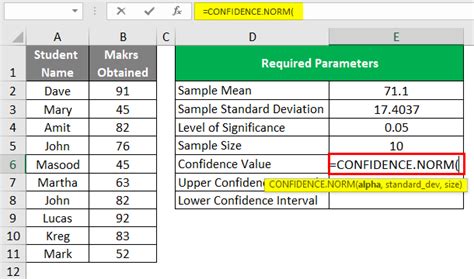
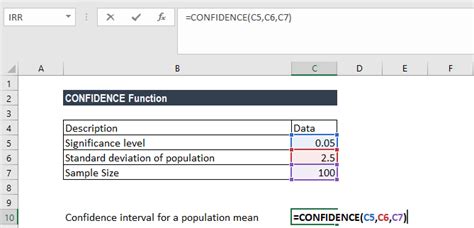
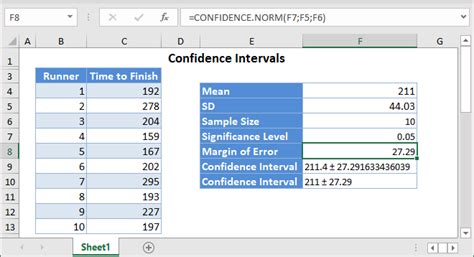
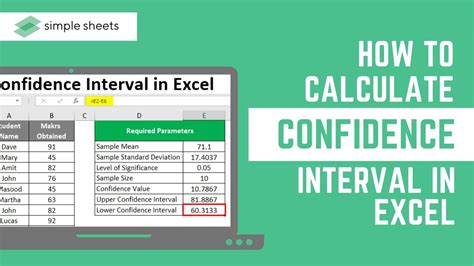
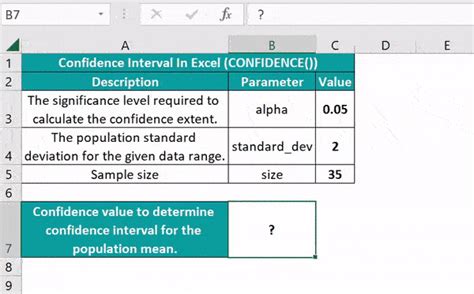
Excel's CONFIDENCE function calculates the confidence interval for a population mean. The syntax is:
CONFIDENCE(alpha, standard_dev, size)
Where:
- alpha is the significance level (e.g., 0.05 for 95% confidence)
- standard_dev is the sample standard deviation
- size is the sample size
For example, suppose we have a sample of exam scores with a mean of 80 and a standard deviation of 10. To calculate the 95% confidence interval, we use:
=CONFIDENCE(0.05, 10, 20)
This returns the margin of error, which we can then use to calculate the confidence interval.
Method 2: Using the Descriptive Statistics Tool
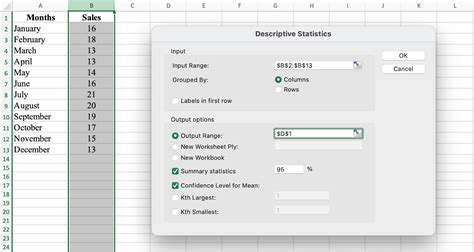
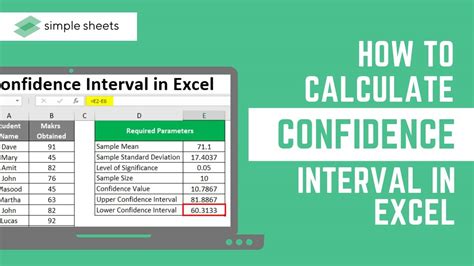
Excel's Descriptive Statistics tool can also be used to calculate confidence intervals. To access this tool, go to Data > Data Analysis > Descriptive Statistics.
In the Descriptive Statistics dialog box, select the data range and choose the confidence level (e.g., 95%). The tool will calculate the confidence interval and display it in the output range.
Method 3: Using the Standard Error Formula
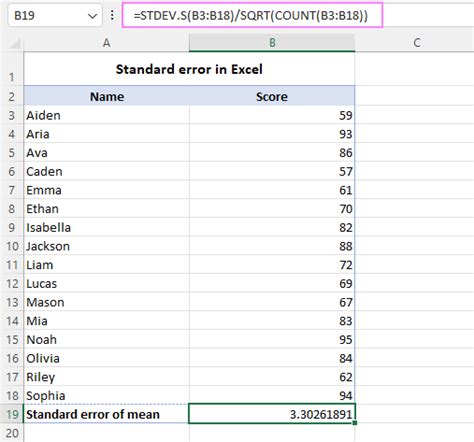
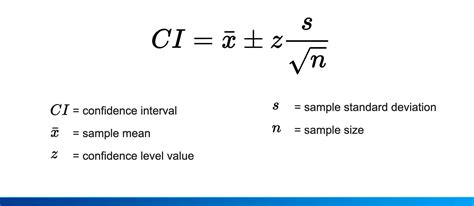
Another way to calculate the confidence interval is to use the standard error formula:
SE = s / sqrt(n)
Where:
- SE is the standard error
- s is the sample standard deviation
- n is the sample size
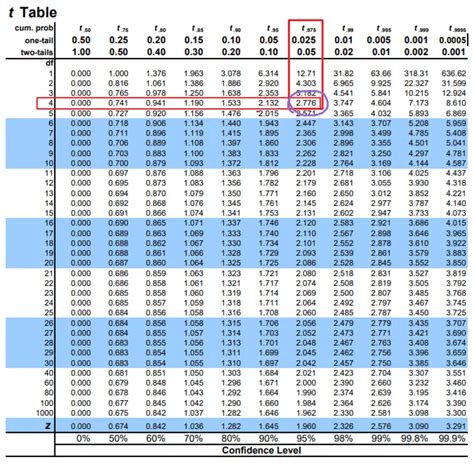
To calculate the confidence interval, multiply the standard error by the critical value from the t-distribution or standard normal distribution.
For example, suppose we have a sample of exam scores with a mean of 80 and a standard deviation of 10. To calculate the 95% confidence interval, we first calculate the standard error:
SE = 10 / sqrt(20) = 2.24
Then, we multiply the standard error by the critical value from the t-distribution (e.g., 2.093 for 20-1=19 degrees of freedom):
Margin of Error = 2.24 x 2.093 = 4.69
The confidence interval is then:
CI = (mean - margin of error, mean + margin of error) = (75.31, 84.69)
Method 4: Using a Macro
If you need to calculate confidence intervals frequently, you can create a macro to automate the process. A macro is a set of instructions that can be executed with a single click.
To create a macro, go to Developer > Visual Basic, and then insert a new module. Paste the following code:
Sub ConfidenceInterval() Dim mean As Double Dim standardDev As Double Dim sampleSize As Integer Dim confidenceLevel As Double Dim marginOfError As Double
' Input values mean = InputBox("Enter the sample mean") standardDev = InputBox("Enter the sample standard deviation") sampleSize = InputBox("Enter the sample size") confidenceLevel = InputBox("Enter the confidence level (e.g., 0.95)")
' Calculate margin of error marginOfError = standardDev / Sqr(sampleSize) * Application.WorksheetFunction.TInv(confidenceLevel, sampleSize - 1)
' Calculate confidence interval lowerLimit = mean - marginOfError upperLimit = mean + marginOfError
' Display results MsgBox "The " & Format(confidenceLevel, "Percent") & " confidence interval is (" & Format(lowerLimit, "0.00") & ", " & Format(upperLimit, "0.00") & ")" End Sub
To run the macro, go to Developer > Macros, select the macro, and click Run.
Method 5: Using a Third-Party Add-In
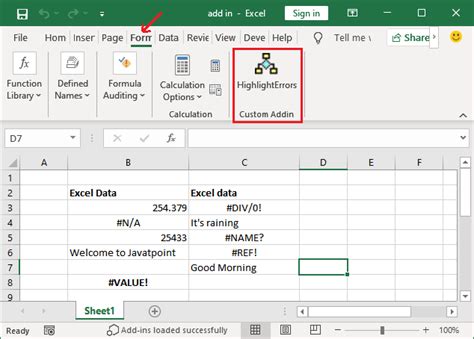
Finally, you can use a third-party add-in to calculate confidence intervals in Excel. There are several add-ins available, including XLSTAT, Analysis ToolPak, and SigmaXL.
These add-ins provide a range of statistical functions, including confidence interval calculations. Simply install the add-in, select the data range, and choose the confidence interval option.
Gallery of Confidence Interval Images:
Confidence Interval Image Gallery


Frequently Asked Questions:
Q: What is the purpose of a confidence interval? A: The purpose of a confidence interval is to estimate the population parameter from a sample of data.
Q: How do I calculate the confidence interval in Excel? A: There are several methods to calculate the confidence interval in Excel, including using the CONFIDENCE function, Descriptive Statistics tool, Standard Error formula, Macro, and third-party add-ins.
Q: What is the difference between a confidence interval and a margin of error? A: The confidence interval is a range of values within which the population parameter is likely to lie, while the margin of error is the maximum amount by which the sample mean may differ from the population mean.
Q: Can I use a confidence interval to compare two populations? A: Yes, you can use a confidence interval to compare two populations by calculating the difference between the two sample means and determining whether the confidence interval includes zero.
Conclusion:
Confidence intervals are an essential statistical tool used to estimate population parameters from sample data. Excel provides various methods to calculate confidence intervals, including using the CONFIDENCE function, Descriptive Statistics tool, Standard Error formula, Macro, and third-party add-ins. By understanding the different methods and their applications, you can make informed decisions in your statistical analysis.
Share your thoughts on this article in the comments section below!
