Outliers can significantly impact the accuracy of your data analysis and decision-making. In Excel, detecting outliers is crucial to ensure that your data is reliable and accurate. In this article, we will explore five ways to detect outliers in Excel.
Why Detect Outliers?
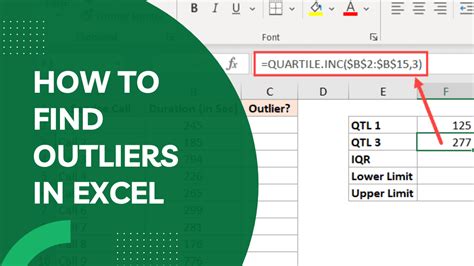
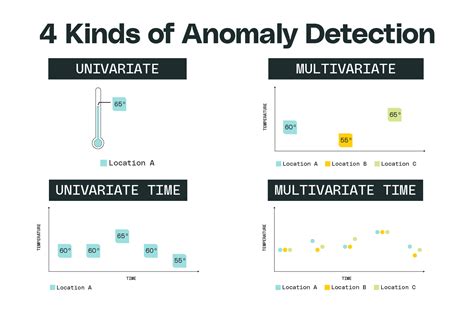
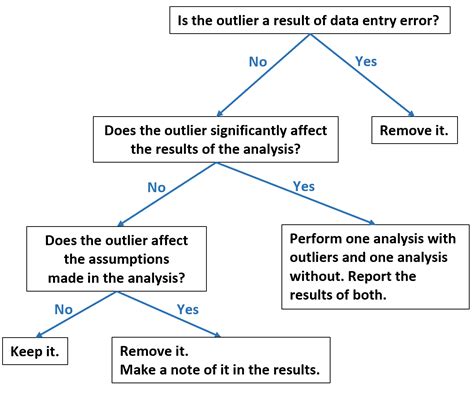
Outliers are data points that are significantly different from the other data points in a dataset. They can be errors in data entry, unusual patterns, or anomalies that can affect the results of your analysis. If left undetected, outliers can lead to incorrect conclusions and decisions. By detecting outliers, you can identify and address potential issues in your data, ensuring that your analysis is accurate and reliable.
Method 1: Visual Inspection

One of the simplest ways to detect outliers is through visual inspection. You can use charts and graphs to visualize your data and identify any unusual patterns or data points that stand out from the rest. In Excel, you can use the built-in charting tools to create histograms, box plots, or scatter plots to help you detect outliers.
To create a histogram in Excel, follow these steps:
- Select the data range that you want to analyze.
- Go to the "Insert" tab in the ribbon.
- Click on the "Histogram" button in the "Charts" group.
- Select the type of histogram that you want to create.
How to Interpret the Results
When interpreting the results of your histogram, look for any data points that are significantly different from the rest. You can use the following guidelines to identify outliers:
- Data points that are more than 2 standard deviations away from the mean.
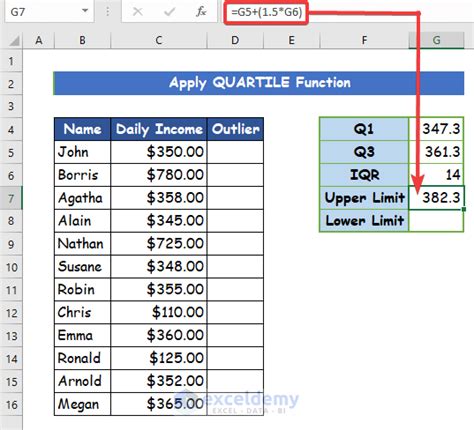
- Data points that are more than 1.5 times the interquartile range (IQR) away from the first or third quartile.
Method 2: Z-Score Method
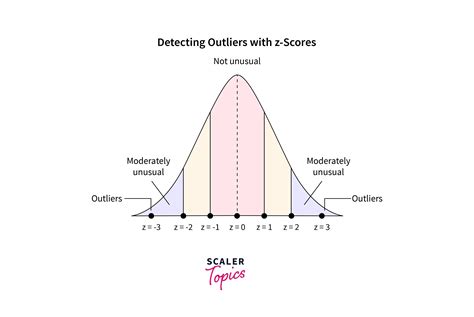
The Z-score method is a statistical technique that calculates the number of standard deviations that a data point is away from the mean. You can use the Z-score formula to calculate the Z-score for each data point in your dataset.
The Z-score formula is:
Z = (X - μ) / σ
Where:
- X is the data point.
- μ is the mean of the dataset.
- σ is the standard deviation of the dataset.
To calculate the Z-score in Excel, follow these steps:
- Calculate the mean and standard deviation of your dataset.
- Use the Z-score formula to calculate the Z-score for each data point.
- Identify any data points with a Z-score greater than 2 or less than -2.
How to Interpret the Results
When interpreting the results of the Z-score method, look for any data points with a Z-score greater than 2 or less than -2. These data points are considered outliers and should be investigated further.
Method 3: Modified Z-Score Method

The modified Z-score method is a variation of the Z-score method that uses the median and median absolute deviation (MAD) instead of the mean and standard deviation. This method is more robust than the Z-score method and can handle datasets with non-normal distributions.
The modified Z-score formula is:
M = (X - M) / MAD
Where:
- X is the data point.
- M is the median of the dataset.
- MAD is the median absolute deviation of the dataset.
To calculate the modified Z-score in Excel, follow these steps:
- Calculate the median and MAD of your dataset.
- Use the modified Z-score formula to calculate the modified Z-score for each data point.
- Identify any data points with a modified Z-score greater than 3 or less than -3.
How to Interpret the Results
When interpreting the results of the modified Z-score method, look for any data points with a modified Z-score greater than 3 or less than -3. These data points are considered outliers and should be investigated further.
Method 4: Density-Based Spatial Clustering of Applications with Noise (DBSCAN)
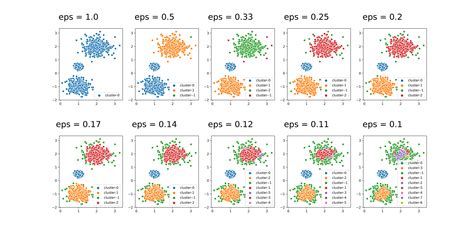
DBSCAN is a density-based clustering algorithm that can be used to detect outliers in datasets. This method is particularly useful for detecting outliers in datasets with complex structures and non-normal distributions.
To use DBSCAN in Excel, follow these steps:
- Install the DBSCAN add-in for Excel.
- Select the data range that you want to analyze.
- Use the DBSCAN algorithm to cluster the data points.
- Identify any data points that are not assigned to a cluster.
How to Interpret the Results
When interpreting the results of DBSCAN, look for any data points that are not assigned to a cluster. These data points are considered outliers and should be investigated further.
Method 5: Isolation Forest

Isolation Forest is an unsupervised learning algorithm that can be used to detect outliers in datasets. This method is particularly useful for detecting outliers in datasets with high-dimensional data.
To use Isolation Forest in Excel, follow these steps:
- Install the Isolation Forest add-in for Excel.
- Select the data range that you want to analyze.
- Use the Isolation Forest algorithm to detect outliers.
- Identify any data points that are detected as outliers.
How to Interpret the Results
When interpreting the results of Isolation Forest, look for any data points that are detected as outliers. These data points are considered outliers and should be investigated further.
Outlier Detection Image Gallery
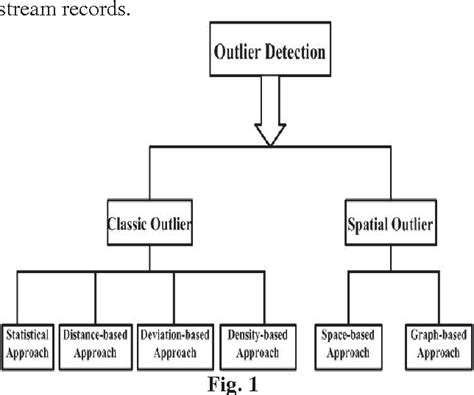

In conclusion, detecting outliers is a crucial step in data analysis to ensure that your results are accurate and reliable. By using one or more of the five methods outlined in this article, you can identify and address potential issues in your data, leading to better decision-making and more effective data-driven insights.
