Intro
Unlock efficient process capability calculations with the Excel formula for Cpk. Discover how to simplify your statistical analysis and improve quality control using this powerful formula. Learn to calculate Cpk values, understand its significance, and optimize your manufacturing processes with this expert guide to Excel formula for Cpk and process capability analysis.
In the world of manufacturing and quality control, process capability is a crucial metric that helps organizations evaluate the performance of their processes. One of the most widely used metrics to measure process capability is Cpk (Capability Index). Calculating Cpk can be a complex task, but with the help of Excel formulas, you can simplify the process and get accurate results quickly.
The Importance of Process Capability
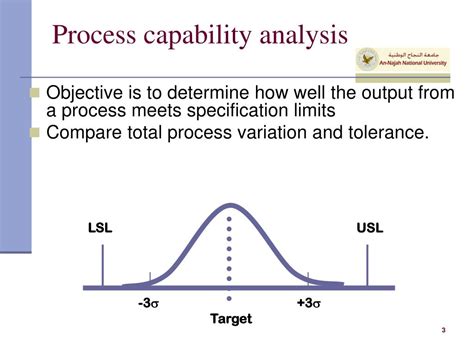
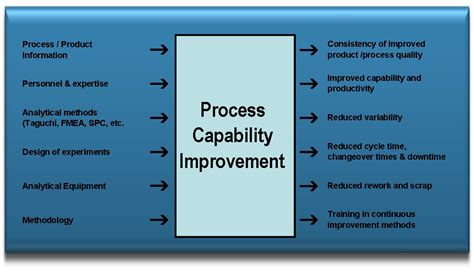
Process capability is a measure of how well a process can produce output within specified limits. It's essential to evaluate process capability to ensure that your processes are stable, reliable, and producing high-quality products. By analyzing process capability, you can identify areas for improvement, reduce waste, and increase customer satisfaction.
Understanding Cpk
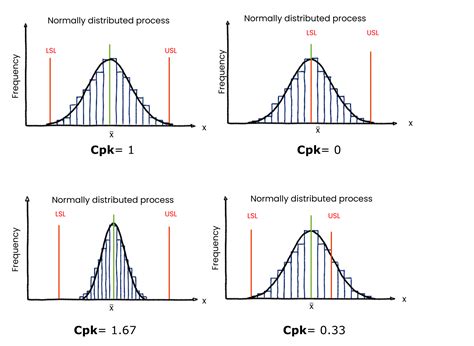
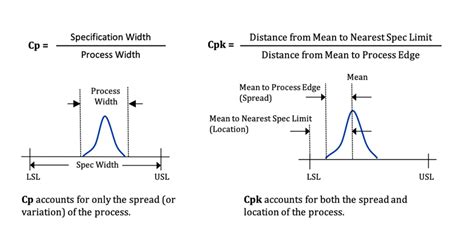
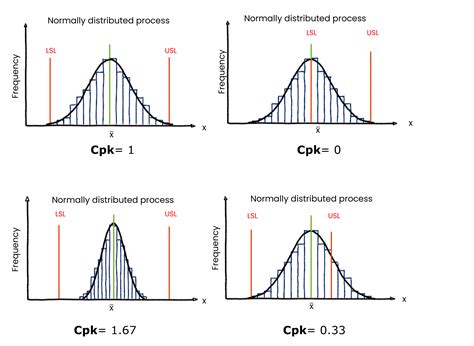
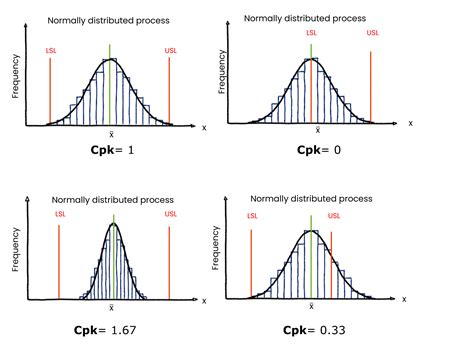
Cpk is a statistical measure that calculates the number of standard deviations between the process mean and the nearest specification limit. It's a widely used metric because it takes into account both the process mean and the process standard deviation. A higher Cpk value indicates that the process is more capable of producing output within the specified limits.
Excel Formula for Cpk
Calculating Cpk in Excel is straightforward. You can use the following formula:
Cpk = MIN((USL - X) / (3 * σ), (X - LSL) / (3 * σ))
Where:
- USL is the Upper Specification Limit
- LSL is the Lower Specification Limit
- X is the process mean
- σ is the process standard deviation
To calculate the process mean and standard deviation, you can use the following formulas:
Process Mean (X) = AVERAGE(range of data) Process Standard Deviation (σ) = STDEV(range of data)
Assuming your data is in cells A1:A100, you can use the following formula:
Cpk = MIN((USL - AVERAGE(A1:A100)) / (3 * STDEV(A1:A100)), (AVERAGE(A1:A100) - LSL) / (3 * STDEV(A1:A100)))

Example:
Suppose you have a manufacturing process that produces metal parts with a target length of 10 cm. The upper specification limit is 10.2 cm, and the lower specification limit is 9.8 cm. You collect a sample of 100 parts and measure their lengths. The data is shown in the table below:
| Length (cm) |
|---|
| 10.1 |
| 9.9 |
| 10.0 |
| ... |
| 10.1 |
Using the Excel formula above, you calculate the process mean and standard deviation:
Process Mean (X) = 10.0 cm Process Standard Deviation (σ) = 0.05 cm
Plugging these values into the Cpk formula, you get:
Cpk = MIN((10.2 - 10.0) / (3 * 0.05), (10.0 - 9.8) / (3 * 0.05)) Cpk = 1.33
Interpretation of Cpk
A Cpk value of 1.33 indicates that the process is capable of producing output within the specified limits. However, the value is not extremely high, indicating that there is room for improvement.
Here are some general guidelines for interpreting Cpk values:
- Cpk < 1: The process is not capable of producing output within the specified limits.
- 1 ≤ Cpk < 1.33: The process is marginally capable, but there is room for improvement.
- 1.33 ≤ Cpk < 1.67: The process is capable, but there is still room for improvement.
- Cpk ≥ 1.67: The process is highly capable and producing high-quality output.
Benefits of Using Excel for Cpk Calculations
Using Excel to calculate Cpk offers several benefits:
- Simplifies complex calculations: Excel formulas simplify the calculation process, reducing the likelihood of errors.
- Increases efficiency: Excel formulas can calculate Cpk quickly, saving time and increasing productivity.
- Enhances accuracy: Excel formulas can handle large datasets and complex calculations, ensuring accurate results.
Common Mistakes to Avoid
When calculating Cpk in Excel, avoid the following common mistakes:
- Incorrect data entry: Ensure that the data is entered correctly, and the formulas are referencing the correct cells.
- Incorrect formula usage: Double-check the formulas to ensure that they are correct and using the correct values.
- Ignoring data distribution: Cpk assumes that the data follows a normal distribution. If the data is not normally distributed, alternative metrics may be more suitable.
Best Practices for Cpk Calculations
To get the most out of your Cpk calculations, follow these best practices:
- Use a large enough sample size: A minimum of 30 data points is recommended to ensure accurate calculations.
- Use a control chart: Control charts can help identify special causes of variation and ensure that the process is stable.
- Monitor and adjust: Regularly monitor the process and adjust as necessary to ensure that the process remains capable.
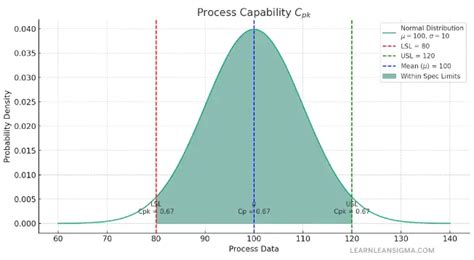
Cpk Formula Variations
While the standard Cpk formula is widely used, there are variations that can be used in specific situations:
- Cpk(u): This formula is used when the process mean is close to the upper specification limit.
- Cpk(l): This formula is used when the process mean is close to the lower specification limit.
- Cpm: This formula is used when the process mean is not centered between the specification limits.
Using Excel formulas to calculate Cpk simplifies the process and reduces the likelihood of errors. By understanding the importance of process capability and how to calculate Cpk, you can make informed decisions to improve your processes and increase customer satisfaction.

Gallery of Process Capability Images
Process Capability Image Gallery




FAQs
Q: What is the difference between Cpk and Ppk? A: Cpk measures the potential capability of a process, while Ppk measures the actual performance of a process.
Q: Can Cpk be used for non-normal data? A: No, Cpk assumes that the data is normally distributed. Alternative metrics, such as Cp, can be used for non-normal data.
Q: How often should Cpk be calculated? A: Cpk should be calculated regularly, ideally after every production batch or whenever there are changes to the process.
Q: Can Cpk be used for multiple variables? A: Yes, Cpk can be used for multiple variables, but it's essential to ensure that the variables are independent and normally distributed.
Conclusion
Calculating Cpk in Excel is a straightforward process that simplifies complex calculations and reduces the likelihood of errors. By understanding the importance of process capability and how to calculate Cpk, you can make informed decisions to improve your processes and increase customer satisfaction. Remember to use a large enough sample size, monitor and adjust the process regularly, and consider alternative metrics for non-normal data. With the right tools and knowledge, you can optimize your processes and achieve operational excellence.
