
Outliers in data can significantly impact the accuracy of analysis and decision-making. Detecting outliers is crucial in ensuring the reliability of your data. Excel provides several methods to identify outliers, and in this article, we will explore five ways to detect outliers in Excel.
Why Detect Outliers?
Outliers are data points that are significantly different from other observations in your dataset. They can be errors in data entry, measurement errors, or unusual patterns in your data. If not detected and handled properly, outliers can lead to incorrect conclusions and decisions. In some cases, outliers may indicate interesting patterns or anomalies in your data that require further investigation.
Method 1: Visual Inspection

One of the simplest ways to detect outliers is through visual inspection. By plotting your data on a chart or graph, you can quickly identify data points that are far away from the rest of the data. Excel provides various chart types, such as scatter plots, histograms, and box plots, that can help you visualize your data and detect outliers.
Creating a Scatter Plot in Excel
To create a scatter plot in Excel, follow these steps:
- Select the data range you want to plot.
- Go to the "Insert" tab in the ribbon.
- Click on the "Scatter" button in the "Charts" group.
- Choose the scatter plot type you want to create.
By examining the scatter plot, you can identify data points that are far away from the rest of the data. These data points may be outliers that require further investigation.
Method 2: Using the Z-Score Method
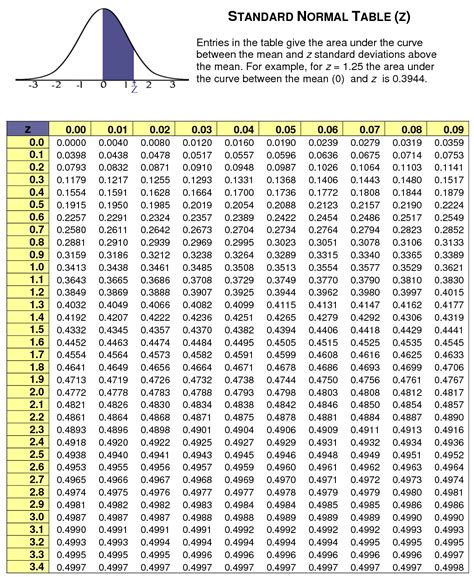
The Z-Score method is a statistical technique used to detect outliers. It measures the number of standard deviations a data point is away from the mean. A Z-Score greater than 2 or less than -2 indicates an outlier.
Calculating the Z-Score in Excel
To calculate the Z-Score in Excel, follow these steps:
- Calculate the mean of your data using the AVERAGE function.
- Calculate the standard deviation of your data using the STDEV function.
- Use the Z-Score formula: Z-Score = (data point - mean) / standard deviation
You can use the following formula in Excel:
= (A1-AVERAGE(A:A)) / STDEV(A:A)
where A1 is the data point you want to calculate the Z-Score for, and A:A is the range of data.
Method 3: Using the Modified Z-Score Method
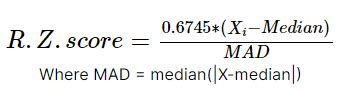
The Modified Z-Score method is similar to the Z-Score method but uses the median and median absolute deviation (MAD) instead of the mean and standard deviation. This method is more robust and can handle non-normal data.
Calculating the Modified Z-Score in Excel
To calculate the Modified Z-Score in Excel, follow these steps:
- Calculate the median of your data using the MEDIAN function.
- Calculate the median absolute deviation (MAD) of your data using the formula: MAD = MEDIAN(ABS(data - median))
- Use the Modified Z-Score formula: Modified Z-Score = 0.6745 * (data point - median) / MAD
You can use the following formula in Excel:
= 0.6745 * (A1-MEDIAN(A:A)) / MEDIAN(ABS(A:A-MEDIAN(A:A)))
where A1 is the data point you want to calculate the Modified Z-Score for, and A:A is the range of data.
Method 4: Using the Box Plot Method
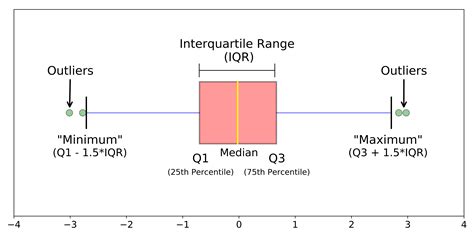
A box plot is a graphical representation of your data that displays the median, quartiles, and outliers. Excel provides a built-in box plot chart that can help you detect outliers.
Creating a Box Plot in Excel
To create a box plot in Excel, follow these steps:
- Select the data range you want to plot.
- Go to the "Insert" tab in the ribbon.
- Click on the "Box and Whisker" button in the "Charts" group.
By examining the box plot, you can identify data points that are outside the whiskers (1.5 times the interquartile range). These data points may be outliers that require further investigation.
Method 5: Using the IQR Method

The IQR method uses the interquartile range (IQR) to detect outliers. The IQR is the difference between the 75th percentile (Q3) and the 25th percentile (Q1). Data points that are outside 1.5 times the IQR from Q1 or Q3 may be considered outliers.
Calculating the IQR in Excel
To calculate the IQR in Excel, follow these steps:
- Calculate the 25th percentile (Q1) and 75th percentile (Q3) of your data using the QUARTILE function.
- Calculate the IQR: IQR = Q3 - Q1
You can use the following formula in Excel:
= QUARTILE(A:A, 3) - QUARTILE(A:A, 1)
where A:A is the range of data.
By using one or a combination of these methods, you can detect outliers in your data and ensure that your analysis is accurate and reliable.
Gallery of Outlier Detection Methods


We hope this article has helped you understand the different methods of detecting outliers in Excel. Do you have any experience with outlier detection? Share your thoughts and questions in the comments below.