The Gaussian curve, also known as the bell curve, is a fundamental concept in statistics and probability theory. It is widely used in various fields, including finance, engineering, and social sciences, to model and analyze continuous data. In this article, we will explore how to create a Gaussian curve in Excel easily.
Understanding the Gaussian Curve
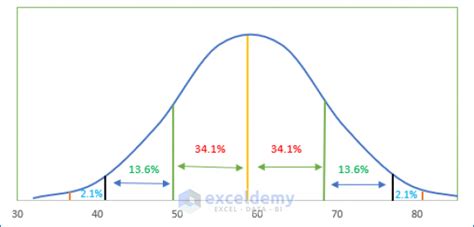
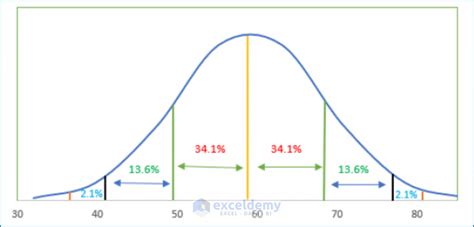
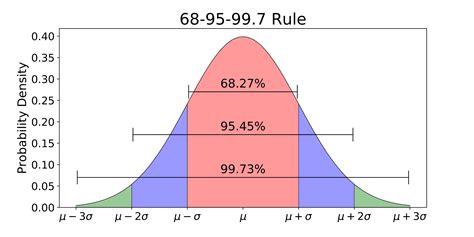
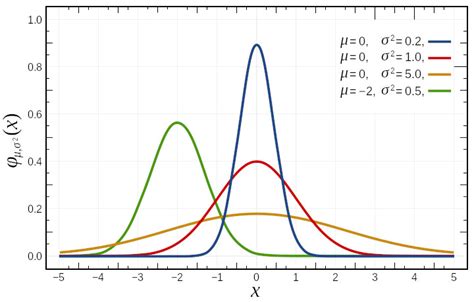
Before we dive into creating a Gaussian curve in Excel, let's briefly understand what it is. The Gaussian curve is a continuous probability distribution that is symmetric about the mean and has a bell-shaped curve. It is characterized by two parameters: the mean (μ) and the standard deviation (σ).
Parameters of the Gaussian Curve
The mean (μ) represents the central tendency of the data, while the standard deviation (σ) represents the spread or dispersion of the data. The Gaussian curve is often used to model data that follows a normal distribution, such as IQ scores, stock prices, or measurement errors.
Creating a Gaussian Curve in Excel
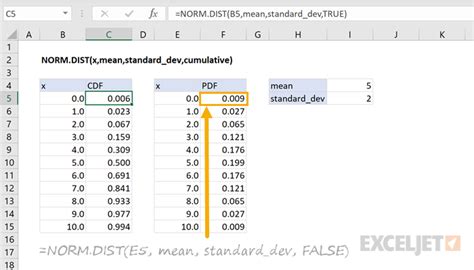
To create a Gaussian curve in Excel, we will use the NORM.DIST function, which returns the probability density function (PDF) of the normal distribution. We will also use the NORM.S.DIST function, which returns the standard normal distribution (Z-distribution).
Step 1: Define the Parameters
Open a new Excel sheet and define the parameters of the Gaussian curve:
| Parameter | Value |
|---|---|
| Mean (μ) | 0 |
| Standard Deviation (σ) | 1 |
You can adjust these values to fit your specific needs.
Step 2: Create a Range of X Values
Create a range of X values that will be used to calculate the corresponding Y values of the Gaussian curve. For example, you can create a range from -3 to 3 with a step size of 0.1.
| X | Y |
|---|---|
| -3 | =NORM.DIST(-3,0,1,FALSE) |
| -2.9 | =NORM.DIST(-2.9,0,1,FALSE) |
| -2.8 | =NORM.DIST(-2.8,0,1,FALSE) |
| ... | ... |
Step 3: Calculate the Y Values
Use the NORM.DIST function to calculate the Y values of the Gaussian curve. The syntax is as follows:
=NORM.DIST(X, μ, σ, FALSE)
where X is the value for which you want to calculate the probability density, μ is the mean, σ is the standard deviation, and FALSE indicates that you want to return the probability density function (PDF) rather than the cumulative distribution function (CDF).
Step 4: Plot the Gaussian Curve
Select the X and Y values and create a scatter plot to visualize the Gaussian curve.
Example Use Cases
The Gaussian curve has many practical applications in various fields. Here are a few examples:
- Finance: The Gaussian curve is used to model stock prices, portfolio returns, and risk management.
- Engineering: The Gaussian curve is used to model measurement errors, signal processing, and control systems.
- Social Sciences: The Gaussian curve is used to model IQ scores, population growth, and opinion polls.
Gallery of Gaussian Curve Images
Gaussian Curve Images


Conclusion
In this article, we have demonstrated how to create a Gaussian curve in Excel using the NORM.DIST function. We have also explored the parameters of the Gaussian curve and its applications in various fields. By following the steps outlined in this article, you can easily create a Gaussian curve in Excel and visualize the distribution of your data.
We hope this article has been informative and helpful. If you have any questions or comments, please feel free to share them below.
