Creating a contingency table in Excel is a straightforward process that can help you analyze and visualize the relationship between two categorical variables. In this article, we will guide you through the steps to create a contingency table in Excel easily and quickly.
Why Use Contingency Tables?
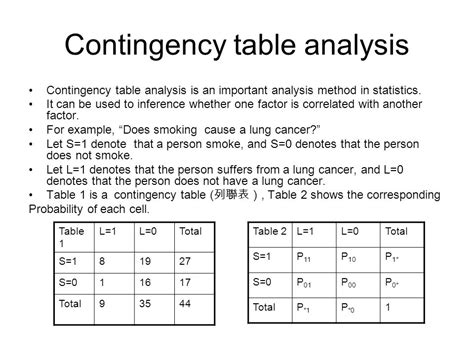
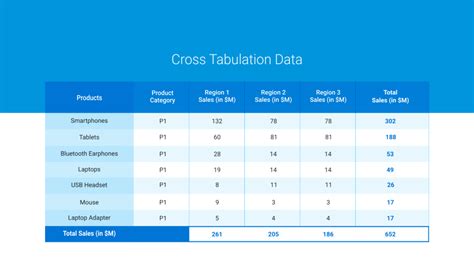
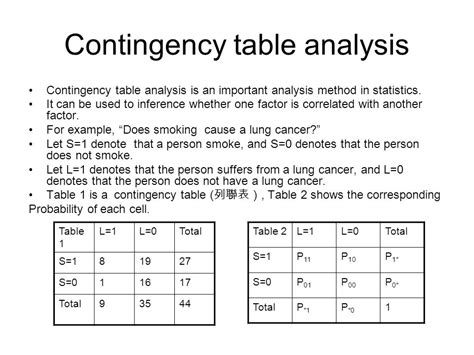
A contingency table, also known as a cross-tabulation table, is a powerful tool used to analyze the relationship between two categorical variables. It helps to identify patterns, trends, and correlations between variables, making it easier to understand complex data. Contingency tables are commonly used in statistics, data analysis, and market research to identify relationships between variables such as age and gender, product usage and customer satisfaction, or country of origin and language spoken.
Step 1: Prepare Your Data
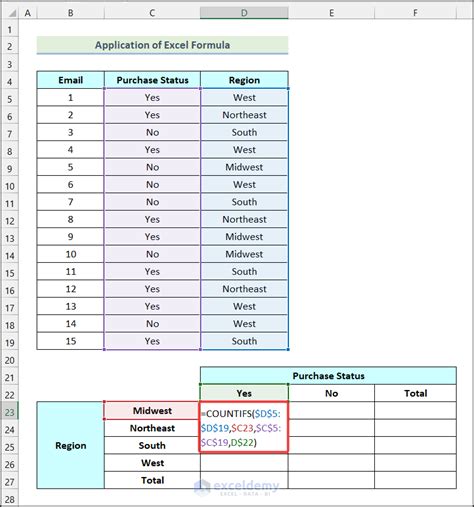
Before creating a contingency table, make sure your data is organized and formatted correctly. Your data should be in a table format with two columns, each representing a categorical variable. For example, if you want to analyze the relationship between age and gender, your data should be organized as follows:
| Age | Gender |
|---|---|
| 18-24 | Male |
| 25-34 | Female |
| 18-24 | Female |
| 35-44 | Male |
| ... | ... |
Step 2: Select the Data Range
Select the entire data range, including the headers, that you want to use to create the contingency table. In our example, select the range A1:B100 (assuming your data is in cells A1:B100).
Step 3: Go to the "Insert" Tab
Click on the "Insert" tab in the Excel ribbon.
Step 4: Click on "PivotTable"
In the "Tables" group, click on the "PivotTable" button.
Step 5: Create a PivotTable
In the "Create PivotTable" dialog box, select a cell where you want to place the contingency table. You can choose to place it in a new worksheet or in an existing one. Click "OK" to create the PivotTable.
Step 6: Drag Fields to the PivotTable
Drag the two categorical variables (Age and Gender) to the "Row Labels" and "Column Labels" areas of the PivotTable. You can also drag them to the "Values" area, but for a contingency table, we only need the counts, so we'll use the "Row Labels" and "Column Labels" areas.
Step 7: Right-Click on the Values Field
Right-click on the "Count of" field in the "Values" area and select "Value Field Settings".
Step 8: Change the Value Field Settings
In the "Value Field Settings" dialog box, select "Count" as the value field and click "OK".
Step 9: Format the Contingency Table
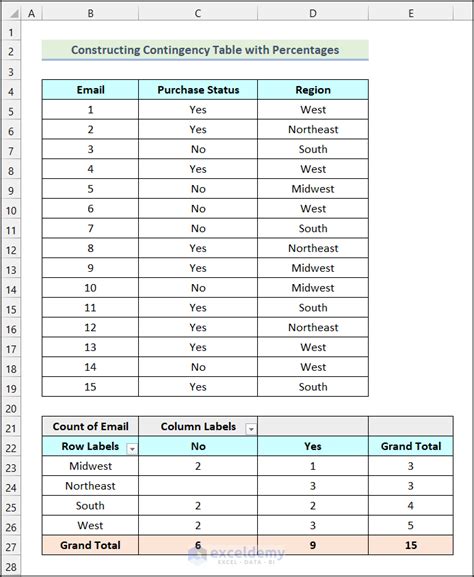
Your contingency table is now created. You can format it to make it more readable by adding borders, adjusting font sizes, and using colors.
Tips and Variations
- To create a contingency table with multiple variables, you can add more fields to the "Row Labels" and "Column Labels" areas.
- To create a contingency table with percentages, you can right-click on the "Count of" field and select "Value Field Settings", then select "Percentage of" as the value field.
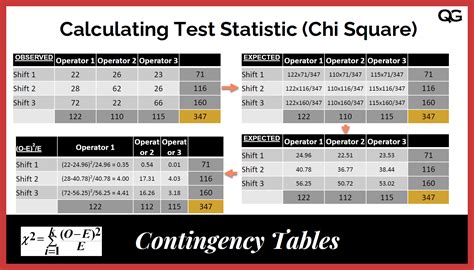
- To create a contingency table with chi-square statistics, you can use the "CHISQ.TEST" function in Excel.
Gallery of Contingency Tables
Contingency Table Image Gallery
FAQs
Q: What is a contingency table? A: A contingency table is a statistical tool used to analyze the relationship between two categorical variables.
Q: How do I create a contingency table in Excel? A: Follow the steps outlined in this article to create a contingency table in Excel.
Q: What are the benefits of using a contingency table? A: Contingency tables help to identify patterns, trends, and correlations between variables, making it easier to understand complex data.
Take Action
Now that you know how to create a contingency table in Excel, try it out with your own data. Experiment with different variables and analyze the results. Share your findings with others and explore the many uses of contingency tables in statistics, data analysis, and market research.
