
Statistical analysis is a crucial aspect of data interpretation, and understanding the distribution of your data is essential to making informed decisions. In this article, we will explore the concept of normal distribution and provide you with 5 ways to test for normal distribution in Excel.
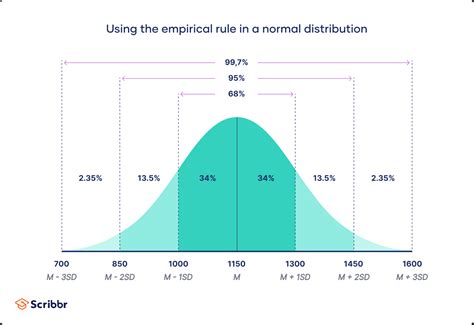
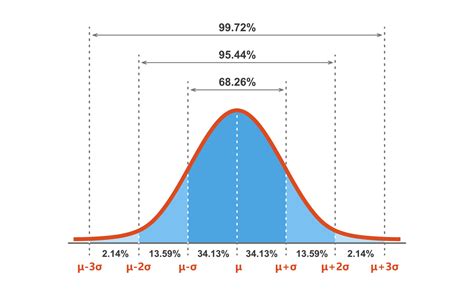
Normal distribution, also known as the Gaussian distribution or bell curve, is a probability distribution that is symmetric about the mean, showing that data near the mean are more frequent in occurrence than data far from the mean. In other words, the majority of the data points cluster around the average value, with fewer occurrences at the extremes.
Testing for normal distribution is vital in statistics, as many statistical tests and models assume that the data follows a normal distribution. If the data is not normally distributed, it may lead to incorrect conclusions or inaccurate predictions. Fortunately, Excel provides several methods to test for normal distribution.
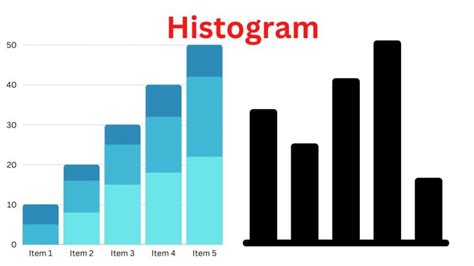
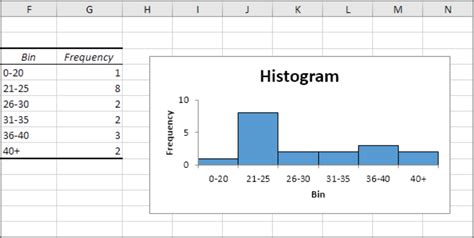
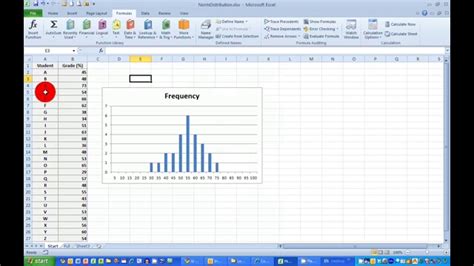
Method 1: Histogram
A histogram is a graphical representation of the distribution of data. It is a simple and intuitive way to visualize the data and check for normality.
To create a histogram in Excel:
- Select the data range you want to analyze.
- Go to the "Insert" tab in the ribbon.
- Click on "Histogram" in the "Charts" group.
- Choose the histogram type and customize the chart as desired.
A normal distribution histogram should be roughly symmetrical and bell-shaped.
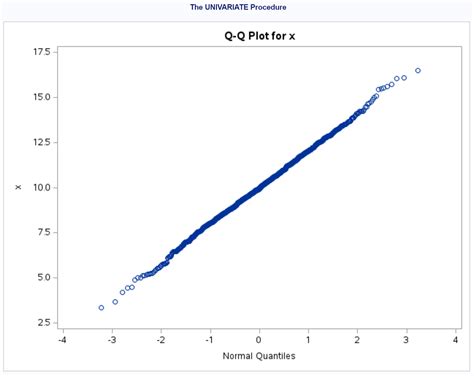
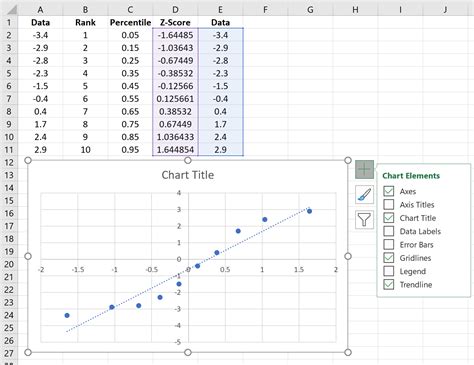
Method 2: Normal Probability Plot (Q-Q Plot)
A normal probability plot, also known as a Q-Q plot, is a graphical method to check for normality. It plots the observed values against the expected normal values.
To create a normal probability plot in Excel:
- Select the data range you want to analyze.
- Go to the "Tools" menu.
- Select "Data Analysis" and then "Regression".
- In the "Regression" dialog box, select "Normal Probability Plot".
- Customize the chart as desired.
A normal distribution Q-Q plot should show a straight line.
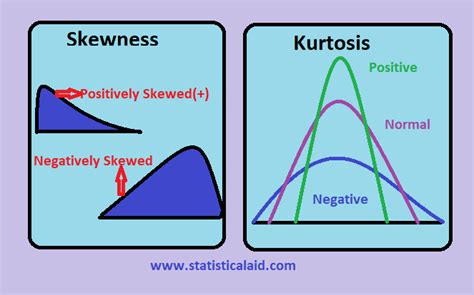
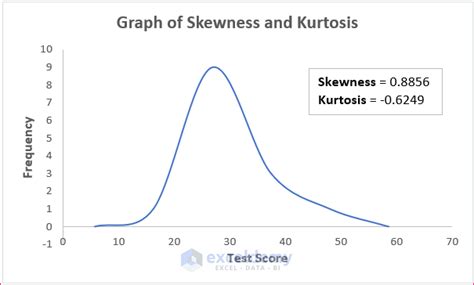
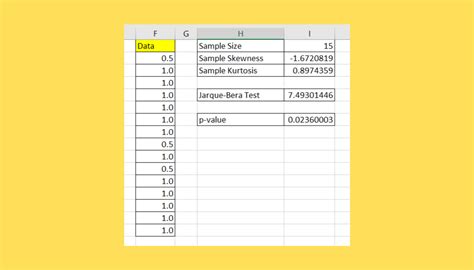
Method 3: Skewness and Kurtosis
Skewness and kurtosis are statistical measures that can help determine if a distribution is normal.
- Skewness measures the asymmetry of the distribution. A normal distribution should have a skewness of zero.
- Kurtosis measures the "tailedness" of the distribution. A normal distribution should have a kurtosis of three.
To calculate skewness and kurtosis in Excel:
- Select the data range you want to analyze.
- Go to the "Formulas" tab in the ribbon.
- Click on "More Functions" and then "Statistical".
- Select "SKEW" for skewness and "KURT" for kurtosis.
- Enter the data range and customize the formula as desired.
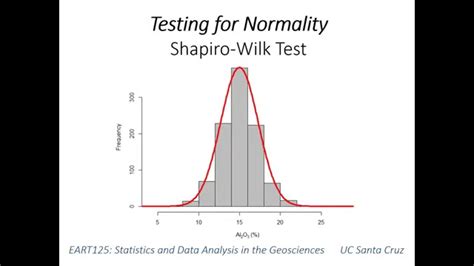
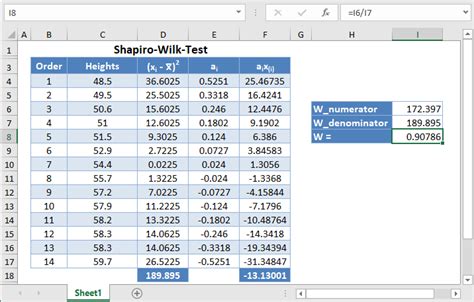
Method 4: Shapiro-Wilk Test
The Shapiro-Wilk test is a statistical test used to determine if a distribution is normal. It is a powerful test that can be used with small sample sizes.
To perform the Shapiro-Wilk test in Excel:
- Select the data range you want to analyze.
- Go to the "Tools" menu.
- Select "Data Analysis" and then "Shapiro-Wilk Test".
- Enter the data range and customize the test as desired.
A p-value less than 0.05 indicates that the distribution is not normal.
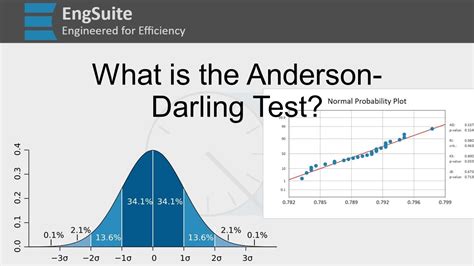
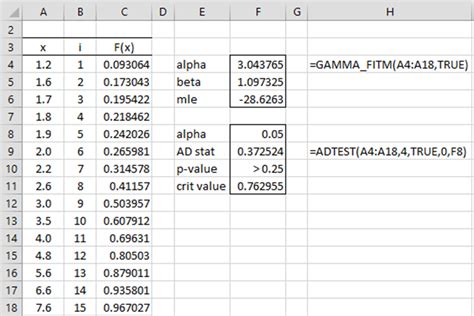
Method 5: Anderson-Darling Test
The Anderson-Darling test is another statistical test used to determine if a distribution is normal. It is a powerful test that can be used with large sample sizes.
To perform the Anderson-Darling test in Excel:
- Select the data range you want to analyze.
- Go to the "Tools" menu.
- Select "Data Analysis" and then "Anderson-Darling Test".
- Enter the data range and customize the test as desired.
A p-value less than 0.05 indicates that the distribution is not normal.
Gallery of Normal Distribution Images
Normal Distribution Image Gallery

Now that you've learned about the different methods to test for normal distribution in Excel, try them out on your own data sets. Remember to always visualize your data and use statistical tests to confirm your findings. Happy analyzing!