Calculating Spearman's rank correlation coefficient in Excel is a useful statistical tool to determine the strength and direction of the relationship between two ranked variables. In this article, we will provide a step-by-step guide on how to calculate Spearman's rank in Excel, along with examples and practical applications.
Why Use Spearman's Rank Correlation Coefficient?
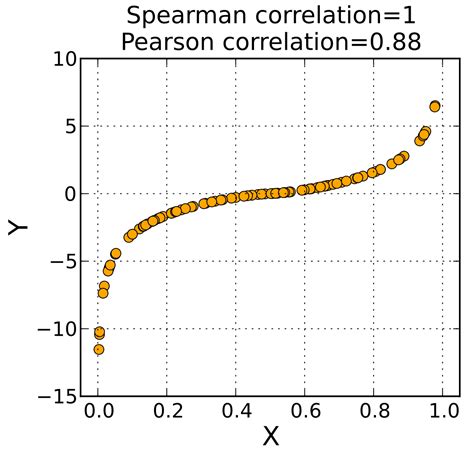
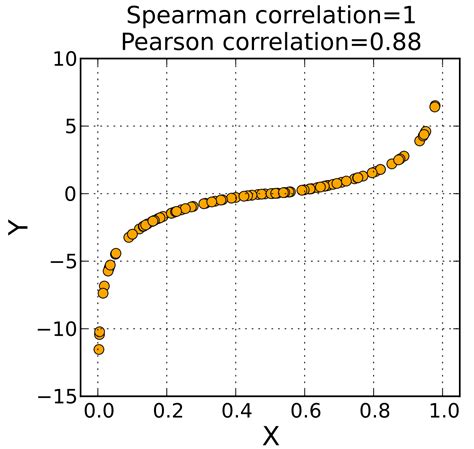
Spearman's rank correlation coefficient is a non-parametric measure of correlation that is suitable for ordinal data or ranked data. It is a useful alternative to Pearson's correlation coefficient when the data does not meet the assumptions of normality or linearity. Spearman's rank correlation coefficient measures the strength and direction of the relationship between two variables, making it an essential tool for data analysis in various fields, including social sciences, medicine, and business.
How to Calculate Spearman's Rank in Excel
Calculating Spearman's rank correlation coefficient in Excel involves several steps:
Step 1: Prepare Your Data
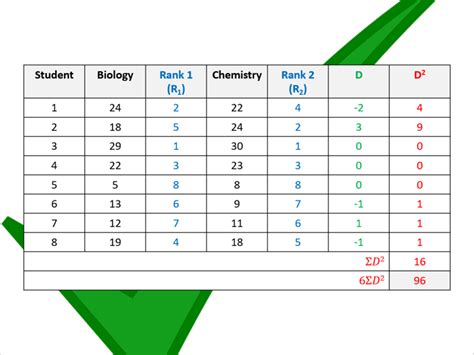
Before calculating Spearman's rank correlation coefficient, you need to prepare your data. Ensure that your data is in a table format with two columns of ranked data. For example, if you want to calculate the correlation between the ranking of two judges in a competition, your data should be in a table with two columns, one for each judge's ranking.
Step 2: Rank Your Data
Rank your data in ascending order using the RANK function in Excel. Select the cell where you want to display the ranked data and type =RANK(A2,$A$2:$A$10) assuming your data is in column A. Copy the formula down to the rest of the cells.
Step 3: Calculate the Differences
Calculate the differences between the two ranked variables using the formula =B2-A2 assuming your ranked data is in columns A and B. Copy the formula down to the rest of the cells.
Step 4: Calculate the Squared Differences
Calculate the squared differences using the formula =(B2-A2)^2. Copy the formula down to the rest of the cells.
Step 5: Calculate the Sum of Squared Differences
Calculate the sum of squared differences using the formula =SUM(C2:C10) assuming your squared differences are in column C.
Step 6: Calculate Spearman's Rank Correlation Coefficient
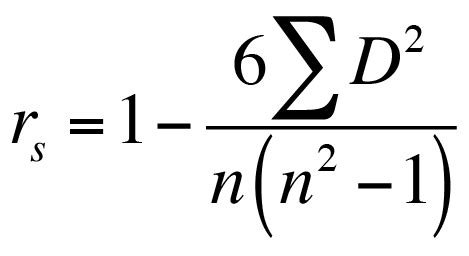
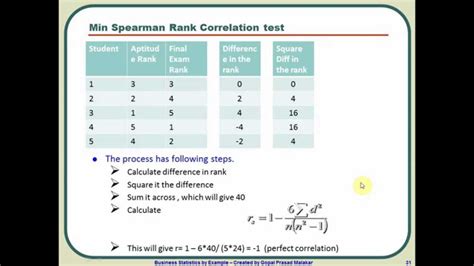
Calculate Spearman's rank correlation coefficient using the formula:
=1-((6*SUM(C2:C10))/(n*(n^2-1)))
where n is the number of observations.
Example
Suppose we have the following data:
| Judge A | Judge B |
|---|---|
| 1 | 2 |
| 2 | 3 |
| 3 | 1 |
| 4 | 4 |
| 5 | 5 |
To calculate Spearman's rank correlation coefficient, follow the steps above:
- Rank the data using the RANK function.
- Calculate the differences between the two ranked variables.
- Calculate the squared differences.
- Calculate the sum of squared differences.
- Calculate Spearman's rank correlation coefficient.
Using the formula above, we get:
=1-((6*SUM(C2:C6))/(5*(5^2-1)))
=1-((6*10)/(5*24))
=0.83
The Spearman's rank correlation coefficient is 0.83, indicating a strong positive correlation between the two judges' rankings.
Gallery of Spearman's Rank Correlation Coefficient
Spearman's Rank Correlation Coefficient Image Gallery

Conclusion
Calculating Spearman's rank correlation coefficient in Excel is a straightforward process that involves ranking your data, calculating the differences, squared differences, and sum of squared differences, and finally applying the formula. This statistical tool is essential for determining the strength and direction of the relationship between two ranked variables. By following the steps outlined in this article, you can easily calculate Spearman's rank correlation coefficient in Excel and gain valuable insights into your data.
