The normal distribution, also known as the Gaussian distribution or bell curve, is a fundamental concept in statistics and data analysis. It's a probability distribution that's symmetric about the mean, showing that data near the mean are more frequent in occurrence than data far from the mean. In many fields, such as finance, engineering, and social sciences, it's crucial to determine if a dataset follows a normal distribution, as many statistical tests and models assume normality.
In this article, we'll explore five ways to test for normal distribution in Excel, a popular spreadsheet software used for data analysis.
Understanding Normal Distribution
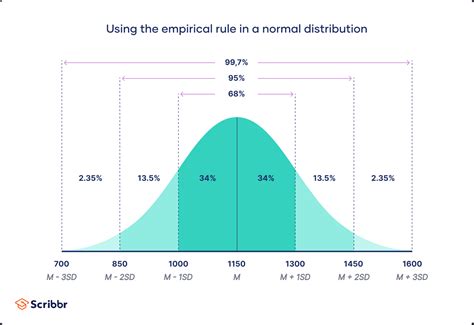
Before we dive into the methods, let's quickly review the characteristics of a normal distribution:
- The distribution is symmetric about the mean.
- The mean, median, and mode are equal.
- The data points are more concentrated around the mean and taper off gradually towards the extremes.
- The distribution is continuous and unbounded.
Method 1: Histogram and Visual Inspection
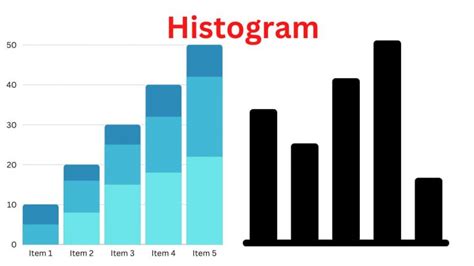
One of the simplest ways to check for normality is to create a histogram of your data and visually inspect its shape. A histogram is a graphical representation of the distribution of your data.
To create a histogram in Excel:
- Select the data range you want to analyze.
- Go to the "Insert" tab and click on "Histogram" in the "Charts" group.
- Customize the histogram as needed.
If the histogram resembles a bell curve, with the majority of the data points concentrated around the mean and tapering off gradually towards the extremes, it may indicate that your data is normally distributed.
Limitations of Visual Inspection
While visual inspection can provide a quick indication of normality, it's not always reliable. Small sample sizes or noisy data can lead to incorrect conclusions.
Method 2: Skewness and Kurtosis
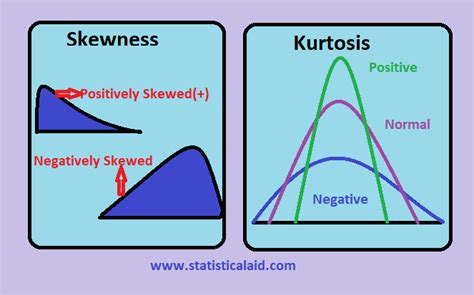
Skewness and kurtosis are two statistical measures that can help determine if a distribution is normal.
- Skewness measures the asymmetry of the distribution. A skewness value close to zero indicates symmetry, which is a characteristic of a normal distribution.
- Kurtosis measures the "tailedness" of the distribution. A kurtosis value close to three indicates that the distribution has tails similar to those of a normal distribution.
To calculate skewness and kurtosis in Excel:
- Select the data range you want to analyze.
- Go to the "Data" tab and click on "Data Analysis" in the "Analysis" group.
- Select "Descriptive Statistics" and click "OK".
- In the output, look for the "Skewness" and "Kurtosis" values.
If the skewness value is close to zero and the kurtosis value is close to three, it may indicate that your data is normally distributed.
Interpretation of Skewness and Kurtosis
While skewness and kurtosis can provide valuable insights, they should be interpreted with caution. Non-normal distributions can still have skewness and kurtosis values close to those of a normal distribution.
Method 3: Q-Q Plot (Quantile-Quantile Plot)
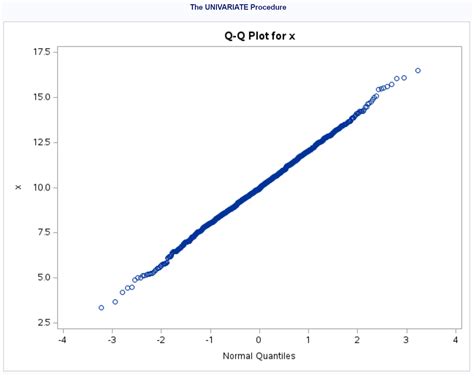
A Q-Q plot, also known as a quantile-quantile plot, is a graphical method for comparing the distribution of two datasets. In this case, we'll compare our data to a normal distribution.
To create a Q-Q plot in Excel:
- Select the data range you want to analyze.
- Go to the "Insert" tab and click on "Scatter" in the "Charts" group.
- Customize the scatter plot as needed.
- Calculate the quantiles of the normal distribution using the
NORM.S.INVfunction. - Plot the quantiles of the normal distribution against the quantiles of your data.
If the points on the Q-Q plot lie approximately on a straight line, it may indicate that your data is normally distributed.
Interpretation of Q-Q Plot
While a Q-Q plot can provide a visual indication of normality, it's not always easy to interpret. Departures from the straight line can be due to various factors, such as non-normality or outliers.
Method 4: Shapiro-Wilk Test
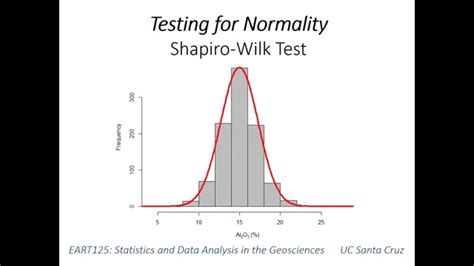
The Shapiro-Wilk test is a statistical test specifically designed to determine if a dataset is normally distributed.
To perform the Shapiro-Wilk test in Excel:
- Select the data range you want to analyze.
- Go to the "Data" tab and click on "Data Analysis" in the "Analysis" group.
- Select "Shapiro-Wilk Test" and click "OK".
- In the output, look for the "W" value and the "p-value".
If the p-value is greater than the chosen significance level (usually 0.05), it indicates that the null hypothesis of normality cannot be rejected, and your data may be normally distributed.
Interpretation of Shapiro-Wilk Test
While the Shapiro-Wilk test is a powerful tool for detecting non-normality, it's not foolproof. Small sample sizes or noisy data can lead to incorrect conclusions.
Method 5: Anderson-Darling Test
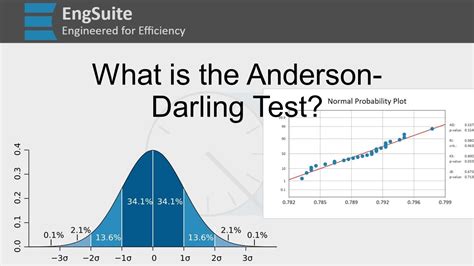
The Anderson-Darling test is another statistical test used to determine if a dataset is normally distributed.
To perform the Anderson-Darling test in Excel:
- Select the data range you want to analyze.
- Go to the "Data" tab and click on "Data Analysis" in the "Analysis" group.
- Select "Anderson-Darling Test" and click "OK".
- In the output, look for the "A" value and the "p-value".
If the p-value is greater than the chosen significance level (usually 0.05), it indicates that the null hypothesis of normality cannot be rejected, and your data may be normally distributed.
Interpretation of Anderson-Darling Test
While the Anderson-Darling test is a powerful tool for detecting non-normality, it's not foolproof. Small sample sizes or noisy data can lead to incorrect conclusions.
Normal Distribution Testing in Excel



In conclusion, determining if a dataset is normally distributed is crucial in many fields. By using a combination of visual inspection, statistical measures, and formal tests, you can gain a better understanding of your data and make more informed decisions.
What's your experience with testing for normal distribution in Excel? Share your thoughts and tips in the comments below!
