Intro
Boost your statistics skills with our comprehensive Z Score Practice Worksheet, featuring solutions and examples to help you master this crucial concept. Learn to calculate and interpret Z scores, understand standard deviation, and apply statistical analysis techniques with confidence. Download now and improve your data analysis skills with our expert-created worksheet.
Understanding the concept of z scores is crucial in statistics, as it helps in comparing data points to their mean and standard deviation. In this article, we will delve into the world of z scores, provide practice worksheets, and offer solutions and examples to help solidify your understanding.
What is a Z Score?
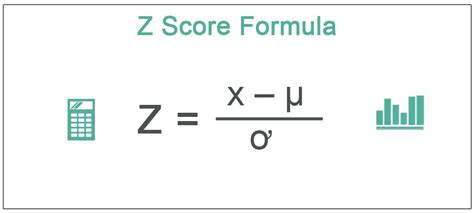
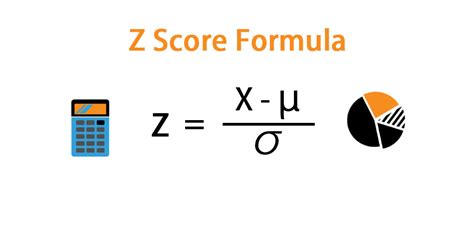
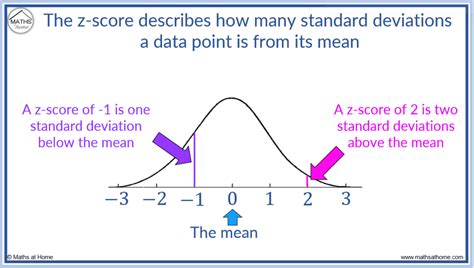
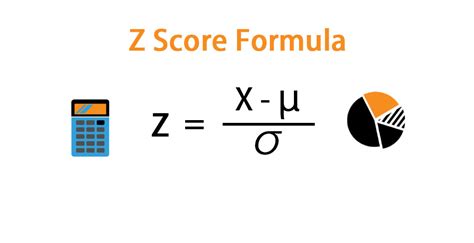
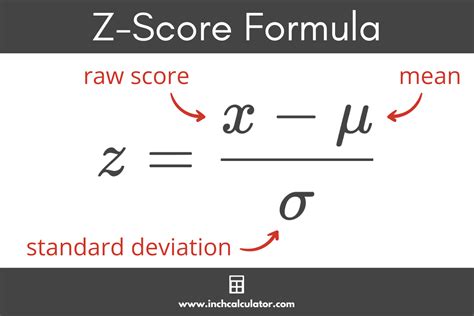
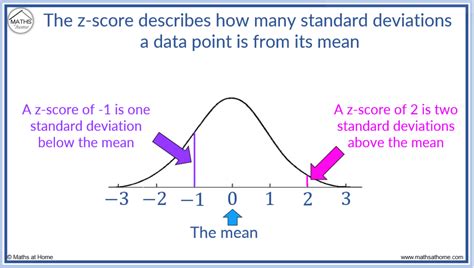
A z score, also known as a standard score, is a dimensionless quantity that indicates how many standard deviations an element is from the mean. The z score is calculated using the following formula:
z = (X - μ) / σ
where X is the data point, μ is the mean, and σ is the standard deviation.
Interpretation of Z Scores
The interpretation of z scores is crucial in understanding the relative position of a data point within a dataset. Here are some key takeaways:
- A z score of 0 indicates that the data point is equal to the mean.
- A positive z score indicates that the data point is above the mean, while a negative z score indicates that it is below the mean.
- The larger the absolute value of the z score, the farther away the data point is from the mean.
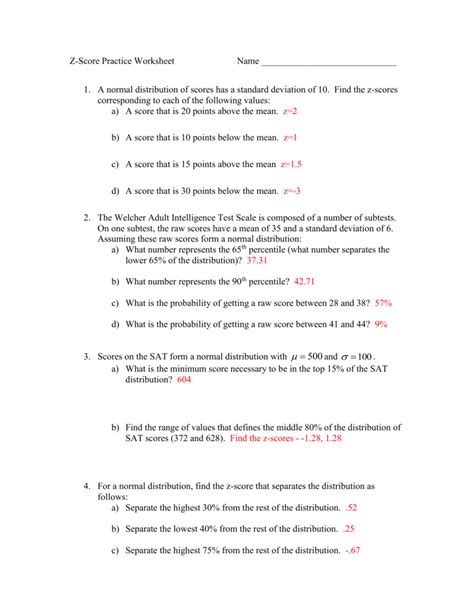
Z Score Practice Worksheet
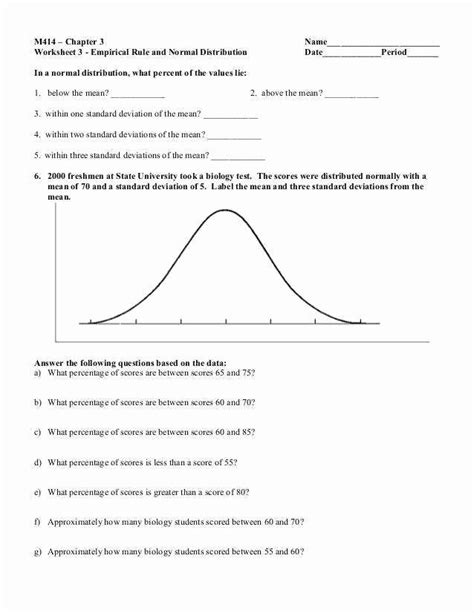
Here's a practice worksheet to help you solidify your understanding of z scores:
Section 1: Calculating Z Scores
- Calculate the z score for a data point of 25, given a mean of 20 and a standard deviation of 5.
- Calculate the z score for a data point of 10, given a mean of 15 and a standard deviation of 3.
- Calculate the z score for a data point of 30, given a mean of 25 and a standard deviation of 2.
Section 2: Interpreting Z Scores
- A data point has a z score of -2. What does this indicate about the data point's position relative to the mean?
- A data point has a z score of 3. What does this indicate about the data point's position relative to the mean?
- A data point has a z score of 0. What does this indicate about the data point's position relative to the mean?
Solutions and Examples
Here are the solutions and examples to help you better understand z scores:
Section 1: Calculating Z Scores
- z = (25 - 20) / 5 = 1
- z = (10 - 15) / 3 = -1.67
- z = (30 - 25) / 2 = 2.5
Section 2: Interpreting Z Scores
- A z score of -2 indicates that the data point is 2 standard deviations below the mean.
- A z score of 3 indicates that the data point is 3 standard deviations above the mean.
- A z score of 0 indicates that the data point is equal to the mean.
Real-World Applications of Z Scores
Z scores have numerous real-world applications, including:
- Predicting stock prices
- Analyzing medical data
- Evaluating student performance
- Determining credit scores
Gallery of Z Score-Related Images
Z Score Image Gallery
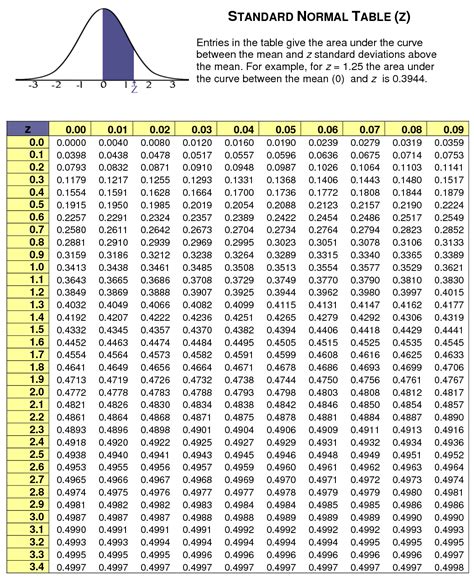
We hope this article has provided you with a comprehensive understanding of z scores, including how to calculate them, interpret them, and apply them in real-world scenarios. Remember to practice using the practice worksheet and solutions provided to solidify your understanding. Share your thoughts and questions in the comments below!
