Intro
Master statistical analysis with our visual guide to Confidence Intervals in Excel. Learn how to calculate and interpret CIs, margin of error, and z-scores. Discover how to use Excel formulas and functions to create intervals and make data-driven decisions. Improve your data analysis skills and gain confidence in your results.
Understanding confidence intervals is crucial in statistics, as they provide a range of values within which a population parameter is likely to lie. In this article, we will explore how to calculate and visualize confidence intervals in Excel, making it easier to interpret and present statistical results.
What are Confidence Intervals?
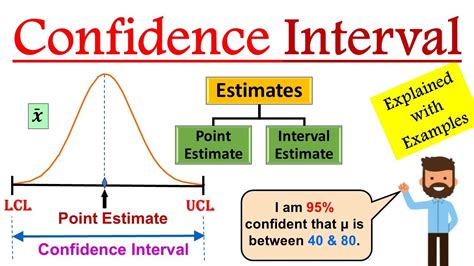
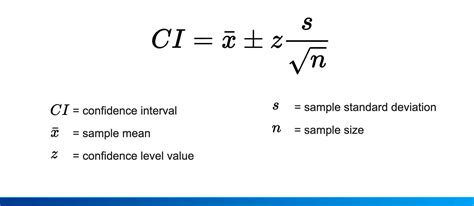
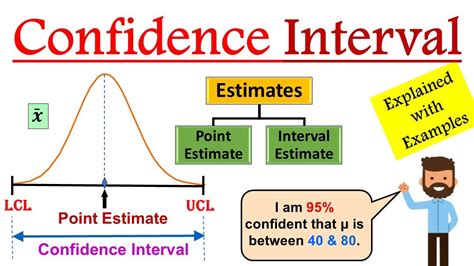
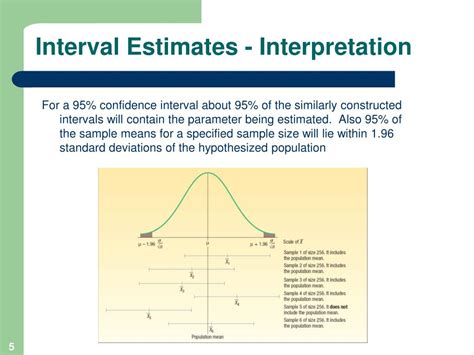
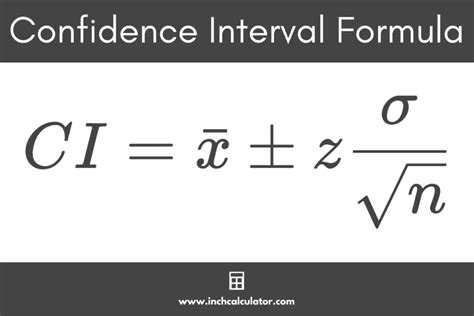
A confidence interval is a statistical tool that provides a range of values within which a population parameter is likely to lie. It is calculated from a sample of data and is used to estimate the population parameter with a certain level of confidence. Confidence intervals are commonly used in hypothesis testing and estimation problems.
Types of Confidence Intervals
There are several types of confidence intervals, including:
- One-sample confidence interval: This type of interval is used to estimate a population parameter based on a single sample.
- Two-sample confidence interval: This type of interval is used to compare the means of two populations based on two independent samples.
- Regression confidence interval: This type of interval is used to estimate the relationship between two variables.
How to Calculate Confidence Intervals in Excel
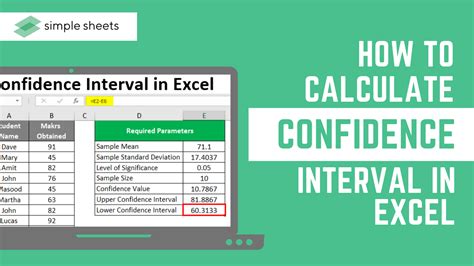
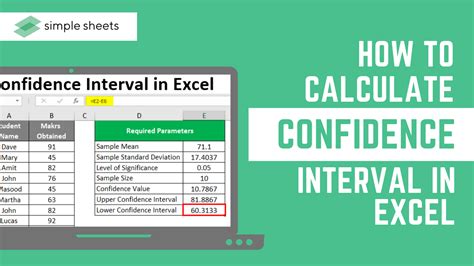
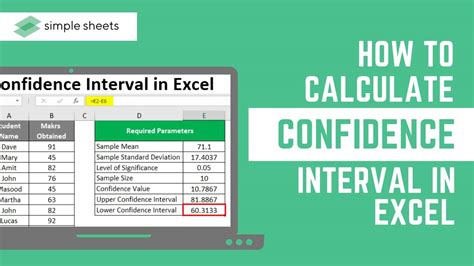
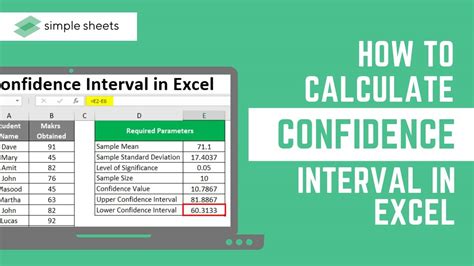
Calculating confidence intervals in Excel is a straightforward process. Here are the steps:
- Sample data: Enter your sample data into a column in Excel.
- Calculate the mean and standard deviation: Use the
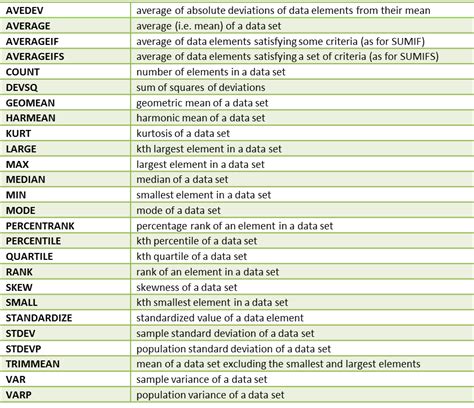
AVERAGEandSTDEVfunctions to calculate the mean and standard deviation of the sample data. - Choose a confidence level: Choose a confidence level, such as 95% or 99%.
- Calculate the margin of error: Use the
CONFIDENCE.Tfunction to calculate the margin of error. - Calculate the confidence interval: Use the
CONFIDENCE.Tfunction to calculate the confidence interval.
Using the CONFIDENCE.T Function in Excel
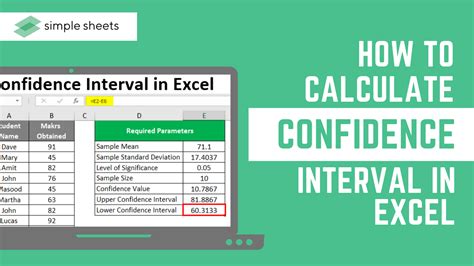
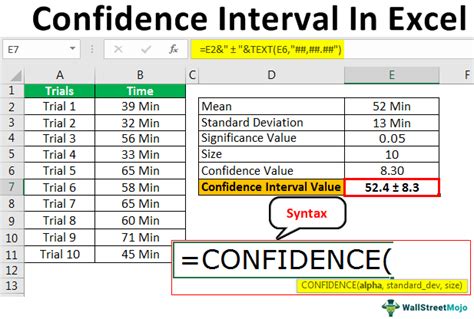
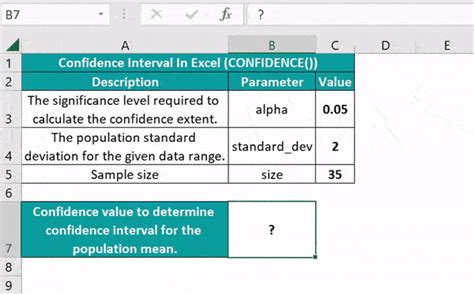
The CONFIDENCE.T function in Excel is used to calculate the confidence interval. The syntax of the function is:
CONFIDENCE.T(alpha, standard_dev, size)
Where:
alphais the significance level (1 - confidence level)standard_devis the standard deviation of the sample datasizeis the sample size
Visualizing Confidence Intervals in Excel
Visualizing confidence intervals in Excel can be done using a variety of charts and graphs. Here are some options:
- Error bars: Use error bars to display the confidence interval on a chart.
- Box plots: Use box plots to display the confidence interval and other summary statistics.
- Histograms: Use histograms to display the distribution of the data and the confidence interval.
Best Practices for Visualizing Confidence Intervals
Here are some best practices for visualizing confidence intervals:
- Use clear and concise labels: Use clear and concise labels to explain the chart or graph.
- Use color effectively: Use color effectively to highlight the confidence interval and other important features of the data.
- Avoid 3D charts: Avoid using 3D charts, as they can be difficult to interpret.
Common Applications of Confidence Intervals
Confidence intervals have a wide range of applications in statistics and data analysis. Here are some common applications:
- Hypothesis testing: Confidence intervals are used to test hypotheses about population parameters.
- Estimation: Confidence intervals are used to estimate population parameters.
- Regression analysis: Confidence intervals are used to estimate the relationship between two variables.
Real-World Examples of Confidence Intervals
Here are some real-world examples of confidence intervals:
- Survey research: Confidence intervals are used to estimate the opinions of a population based on a sample of survey respondents.
- Medical research: Confidence intervals are used to estimate the effectiveness of a new treatment based on a sample of patients.
- Business analytics: Confidence intervals are used to estimate the demand for a new product based on a sample of customers.
Confidence Intervals in Excel Image Gallery
In conclusion, confidence intervals are a powerful tool in statistics and data analysis. By understanding how to calculate and visualize confidence intervals in Excel, you can gain insights into your data and make more informed decisions. We hope this article has been helpful in explaining confidence intervals in Excel.
