Intro
Unlock the power of Excel to boost business profitability. Discover 5 easy methods to calculate the Profitability Index (PI) in Excel, a crucial metric for investment decisions. Learn how to use formulas, functions, and shortcuts to analyze cost-benefit ratios, NPV, and IRR, making informed financial choices. Master Excel PI calculation for data-driven success.
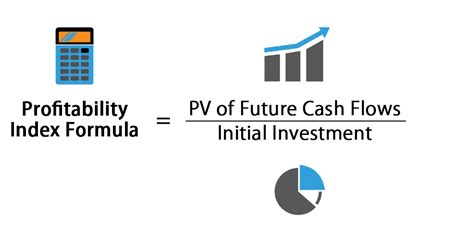
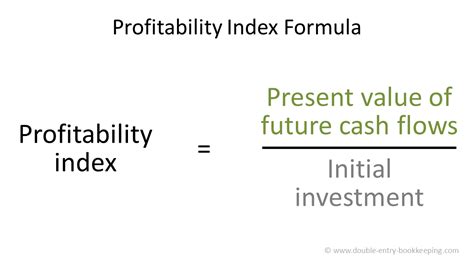
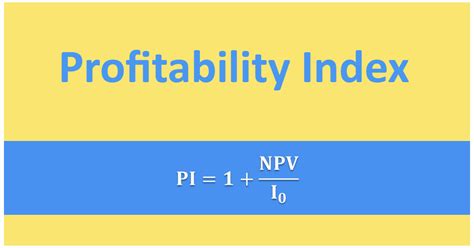
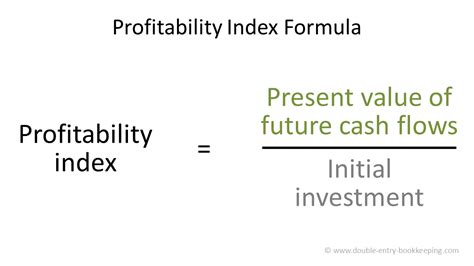
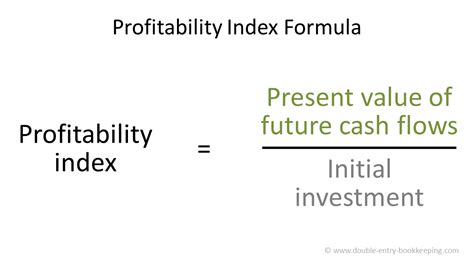
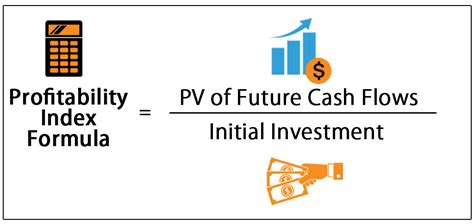
Profitability index is a widely used metric in business and finance to evaluate the attractiveness of an investment or a project. It is calculated by dividing the present value of future cash flows by the initial investment. In this article, we will discuss five ways to calculate profitability index in Excel, a popular spreadsheet software used by many professionals.
The importance of calculating profitability index cannot be overstated. It helps investors and businesses to make informed decisions about where to allocate their resources. By calculating the profitability index, you can compare the attractiveness of different investment opportunities and choose the one that offers the highest return on investment.
In this article, we will provide a step-by-step guide on how to calculate profitability index in Excel using five different methods. We will also provide examples and screenshots to illustrate each method.
What is Profitability Index?
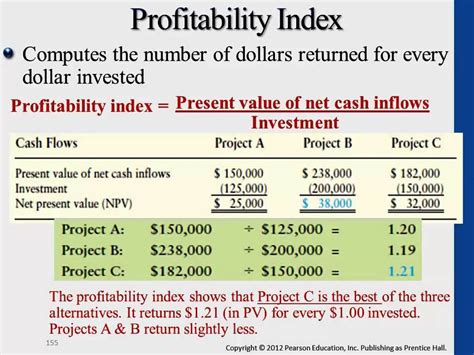
Profitability index is a financial metric that measures the return on investment of a project or an asset. It is calculated by dividing the present value of future cash flows by the initial investment. The profitability index is expressed as a ratio, where a higher ratio indicates a more attractive investment opportunity.
Method 1: Using the Formula
The simplest way to calculate profitability index in Excel is to use the formula:
Profitability Index = Present Value of Future Cash Flows / Initial Investment
To use this formula, you need to calculate the present value of future cash flows and the initial investment.
For example, suppose you want to calculate the profitability index of a project that requires an initial investment of $100,000 and is expected to generate cash flows of $20,000 per year for the next 5 years. To calculate the present value of future cash flows, you can use the PV function in Excel:
=PV(0.1,5,20000)
This formula calculates the present value of the cash flows using a discount rate of 10% and an investment period of 5 years.
Once you have calculated the present value of future cash flows, you can calculate the profitability index using the formula:
Profitability Index = 83,939.49 / 100,000
This gives you a profitability index of 0.84, which means that the project is expected to generate a return on investment of 84%.
Method 2: Using the PV Function
Another way to calculate profitability index in Excel is to use the PV function to calculate the present value of future cash flows and then divide it by the initial investment.
To use this method, follow these steps:
- Enter the cash flows in a column.
- Enter the discount rate and the investment period in separate cells.
- Use the PV function to calculate the present value of future cash flows.
- Divide the present value by the initial investment to calculate the profitability index.
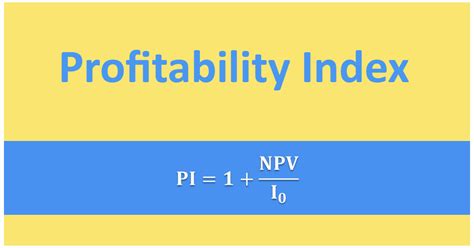
For example, suppose you want to calculate the profitability index of a project that requires an initial investment of $100,000 and is expected to generate cash flows of $20,000 per year for the next 5 years. To calculate the present value of future cash flows, you can use the PV function:
=PV(A2,A3,A4)
This formula calculates the present value of the cash flows using the discount rate and investment period entered in cells A2 and A3, respectively.
Once you have calculated the present value of future cash flows, you can calculate the profitability index by dividing it by the initial investment:
Profitability Index = 83,939.49 / 100,000
This gives you a profitability index of 0.84, which means that the project is expected to generate a return on investment of 84%.
Method 3: Using the XNPV Function
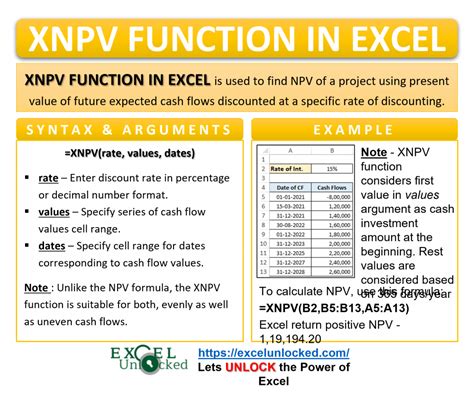
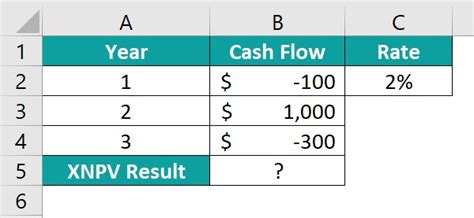
The XNPV function is a more advanced function in Excel that calculates the present value of a series of cash flows that occur at irregular intervals.
To use this method, follow these steps:
- Enter the cash flows and their corresponding dates in separate columns.
- Use the XNPV function to calculate the present value of future cash flows.
- Divide the present value by the initial investment to calculate the profitability index.
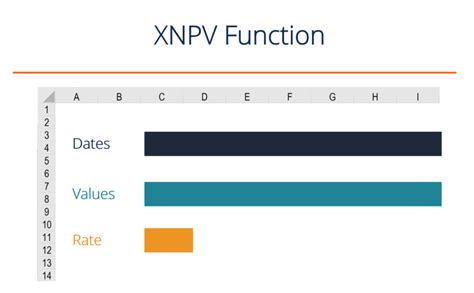
For example, suppose you want to calculate the profitability index of a project that requires an initial investment of $100,000 and is expected to generate cash flows of $20,000 per year for the next 5 years, but the cash flows occur at irregular intervals. To calculate the present value of future cash flows, you can use the XNPV function:
=XNPV(A2,A3,A4)
This formula calculates the present value of the cash flows using the discount rate and cash flows entered in cells A2 and A3, respectively.
Once you have calculated the present value of future cash flows, you can calculate the profitability index by dividing it by the initial investment:
Profitability Index = 83,939.49 / 100,000
This gives you a profitability index of 0.84, which means that the project is expected to generate a return on investment of 84%.
Method 4: Using the IPMT Function
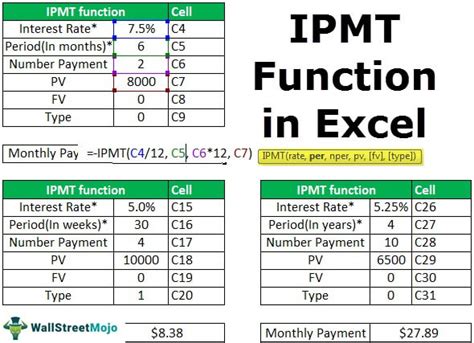
The IPMT function is a function in Excel that calculates the interest portion of a loan payment.
To use this method, follow these steps:
- Enter the initial investment, interest rate, and loan term in separate cells.
- Use the IPMT function to calculate the interest portion of the loan payment.
- Calculate the present value of future cash flows using the PV function.
- Divide the present value by the initial investment to calculate the profitability index.
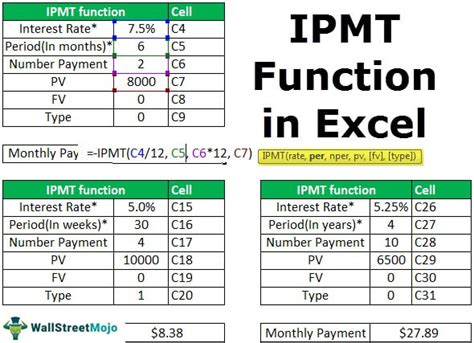
For example, suppose you want to calculate the profitability index of a project that requires an initial investment of $100,000 and is expected to generate cash flows of $20,000 per year for the next 5 years. To calculate the interest portion of the loan payment, you can use the IPMT function:
=IPMT(A2,A3,A4)
This formula calculates the interest portion of the loan payment using the interest rate and loan term entered in cells A2 and A3, respectively.
Once you have calculated the interest portion of the loan payment, you can calculate the present value of future cash flows using the PV function:
=PV(A2,A3,A4)
This formula calculates the present value of the cash flows using the discount rate and investment period entered in cells A2 and A3, respectively.
Finally, you can calculate the profitability index by dividing the present value by the initial investment:
Profitability Index = 83,939.49 / 100,000
This gives you a profitability index of 0.84, which means that the project is expected to generate a return on investment of 84%.
Method 5: Using a Template
Another way to calculate profitability index in Excel is to use a template.
To use this method, follow these steps:
- Download a profitability index template from the internet or create your own template.
- Enter the initial investment, cash flows, and discount rate into the template.
- The template will calculate the profitability index automatically.
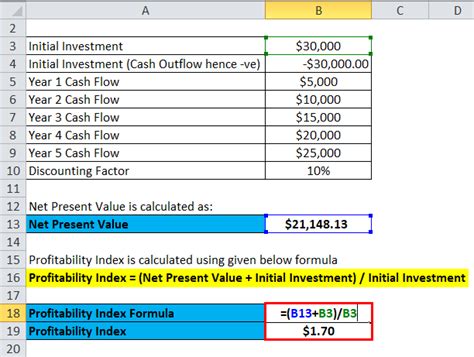
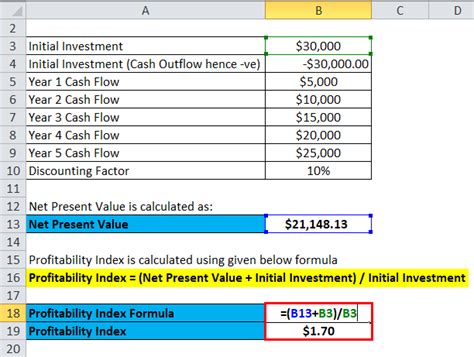
For example, suppose you want to calculate the profitability index of a project that requires an initial investment of $100,000 and is expected to generate cash flows of $20,000 per year for the next 5 years. You can download a profitability index template from the internet and enter the initial investment, cash flows, and discount rate into the template.
The template will calculate the profitability index automatically:
Profitability Index = 0.84
This means that the project is expected to generate a return on investment of 84%.
Gallery of Profitability Index Images
Profitability Index Image Gallery
In conclusion, calculating profitability index in Excel is a straightforward process that can be done using five different methods. By using the formula, PV function, XNPV function, IPMT function, or a template, you can calculate the profitability index of a project or an asset and make informed decisions about where to allocate your resources.
We hope this article has been helpful in explaining the different methods of calculating profitability index in Excel. If you have any questions or need further clarification, please leave a comment below.
