Determining the right sample size is crucial in statistical analysis, as it directly affects the reliability and accuracy of the results. When conducting research or analysis, selecting a sample that is too small may lead to inconclusive results, while a sample that is too large can be wasteful and unnecessary. In this article, we will delve into the concept of sample size and explore how to calculate it using Excel.
Understanding Sample Size

Sample size refers to the number of observations or data points included in a study or analysis. It is an essential aspect of research design, as it determines the precision and reliability of the results. A larger sample size generally provides more accurate results, but it also increases the cost and time required for data collection.
Why is Sample Size Important?

A well-chosen sample size is critical in ensuring the validity and reliability of research findings. Here are some reasons why sample size is important:
- Precision: A larger sample size provides more precise estimates, as it reduces the margin of error.
- Reliability: A sufficient sample size increases the reliability of the results, as it reduces the impact of random errors.
- Generalizability: A representative sample size allows for generalization of the findings to the population.
- Cost-effectiveness: A well-chosen sample size balances the cost and time required for data collection with the desired level of precision.
Sample Size Formula in Excel

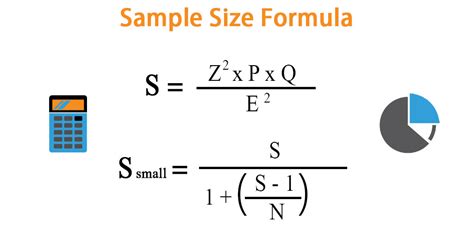
The sample size formula in Excel can be calculated using the following formula:
n = (Z^2 * p * (1-p)) / E^2
Where:
- n = sample size
- Z = Z-score corresponding to the desired confidence level
- p = population proportion (estimated)
- E = margin of error
To calculate the sample size in Excel, follow these steps:
- Open a new Excel worksheet.
- Enter the desired confidence level (e.g., 95%) and margin of error (e.g., 5%).
- Estimate the population proportion (p).
- Use the Z-score formula to calculate the Z-score corresponding to the desired confidence level.
- Plug in the values into the sample size formula.
Example: Calculating Sample Size in Excel

Suppose we want to conduct a survey to estimate the proportion of customers who prefer a new product feature. We want to achieve a 95% confidence level with a margin of error of 5%. We estimate that 60% of customers will prefer the new feature.
Using the sample size formula, we calculate:
- Z = 1.96 (corresponding to a 95% confidence level)
- p = 0.6 (estimated population proportion)
- E = 0.05 (margin of error)
Plugging in the values, we get:
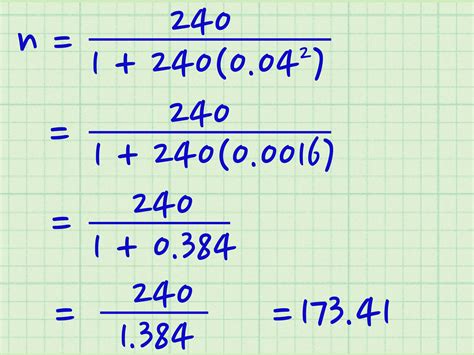
n = (1.96^2 * 0.6 * (1-0.6)) / 0.05^2 n ≈ 384.16
Rounding up to the nearest whole number, we get a sample size of 385.
Conclusion
Calculating sample size is a crucial step in research design, and using Excel can make the process easier and more accurate. By understanding the concept of sample size and using the formula provided, you can ensure that your research findings are reliable, precise, and generalizable.
