Excel is an incredibly powerful tool for data analysis, and calculating the interquartile range (IQR) is a valuable skill for any data analyst or scientist. In this article, we will explore the concept of IQR, its importance, and provide a step-by-step guide on how to calculate it in Excel.
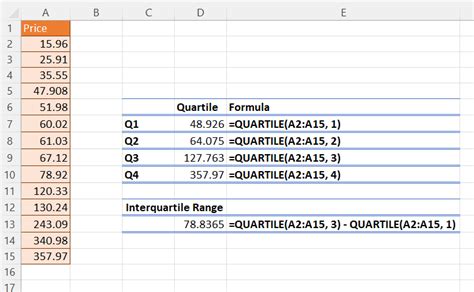
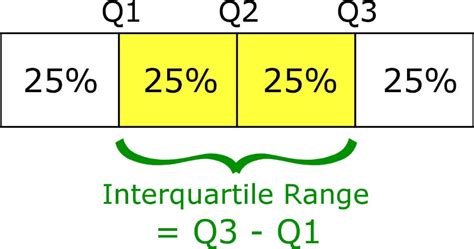
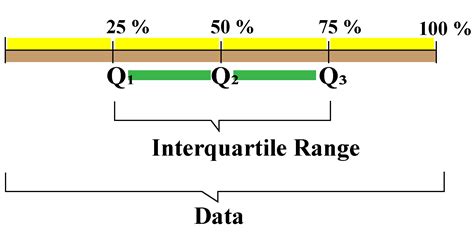
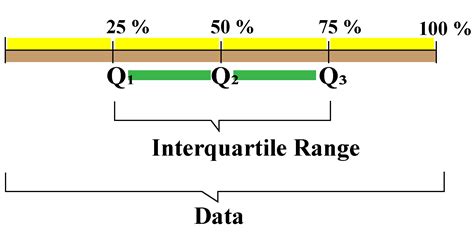
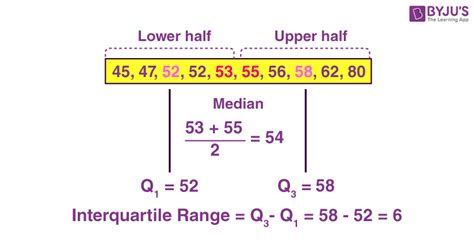
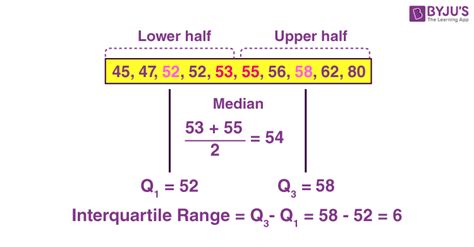
The interquartile range is a measure of the spread of a dataset, representing the difference between the 75th percentile (Q3) and the 25th percentile (Q1). It is a useful metric for understanding the distribution of data and identifying potential outliers.
Why is Interquartile Range Important?
The IQR is an essential statistic in data analysis, as it provides insight into the variability of a dataset. By calculating the IQR, you can:
- Identify the range of the middle 50% of the data
- Detect potential outliers and anomalies
- Compare the spread of different datasets
- Create box plots and other visualizations to communicate data insights
Benefits of Using Interquartile Range
The IQR has several benefits over other measures of spread, such as the range:
- It is more robust to outliers, as it only considers the middle 50% of the data
- It is a better representation of the data's spread, as it is less affected by extreme values
- It is easier to calculate and interpret than other measures of spread, such as the standard deviation
Calculating Interquartile Range in Excel
Calculating the IQR in Excel is a straightforward process that can be accomplished using the following steps:
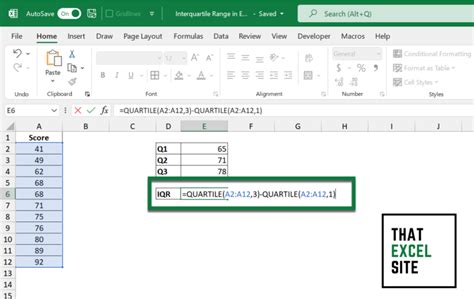
- Arrange your data in a column, from smallest to largest
- Enter the following formula into a cell:
=QUARTILE.EXC(A1:A10, 3) - QUARTILE.EXC(A1:A10, 1) - Replace
A1:A10with the range of cells containing your data - Press Enter to calculate the IQR
The QUARTILE.EXC function is used to calculate the 25th and 75th percentiles of the data. The 3 and 1 arguments specify the 75th and 25th percentiles, respectively. By subtracting the 25th percentile from the 75th percentile, you can calculate the IQR.
Alternative Method Using PERCENTILE Function
Alternatively, you can use the PERCENTILE function to calculate the IQR:
- Arrange your data in a column, from smallest to largest
- Enter the following formula into a cell:
=PERCENTILE(A1:A10, 0.75) - PERCENTILE(A1:A10, 0.25) - Replace
A1:A10with the range of cells containing your data - Press Enter to calculate the IQR
Interquartile Range Example
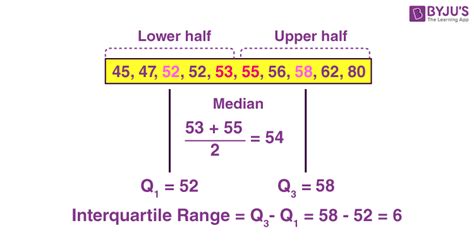
To illustrate the calculation of the IQR, let's consider an example:
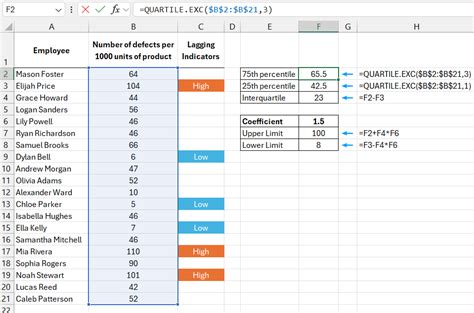
Suppose we have a dataset containing the following values: 2, 4, 6, 8, 10, 12, 14, 16, 18, 20
Using the QUARTILE.EXC function, we can calculate the IQR as follows:
=QUARTILE.EXC(A1:A10, 3) - QUARTILE.EXC(A1:A10, 1)
This returns a value of 8, indicating that the middle 50% of the data falls within a range of 8 units.
Interpretation of Results
The IQR can be interpreted as follows:
- A small IQR indicates that the data is concentrated around the median, with few outliers
- A large IQR indicates that the data is spread out, with many outliers
In the example above, the IQR of 8 indicates that the data is moderately spread out, with some outliers present.
Gallery of Interquartile Range Examples
Interquartile Range Examples
We hope this article has provided a comprehensive guide to calculating the interquartile range in Excel. By following the steps outlined above, you can easily calculate the IQR and gain a deeper understanding of your data.
If you have any questions or need further assistance, please don't hesitate to comment below. We would be happy to help.
Share this article with your friends and colleagues who may find it useful. Don't forget to subscribe to our blog for more Excel tutorials and data analysis tips!
