Calculating B1 and B0 in Excel is a fundamental concept in linear regression analysis. It's a crucial step in understanding the relationship between a dependent variable and one or more independent variables. In this article, we'll break down the process of calculating B1 and B0 in Excel, making it easy to follow and understand.
Why Calculate B1 and B0?
Before diving into the calculation process, let's quickly understand the significance of B1 and B0.
In linear regression, B1 represents the slope coefficient, which measures the change in the dependent variable for a one-unit change in the independent variable. B0, on the other hand, represents the intercept or constant term, which is the value of the dependent variable when the independent variable is equal to zero.
Assumptions and Requirements
To calculate B1 and B0 in Excel, you'll need:
- A dataset with a dependent variable (y) and one or more independent variables (x)
- The dataset should be in a table format with headers in the first row
- Excel 2013 or later version
Step-by-Step Calculation Process
To calculate B1 and B0 in Excel, follow these steps:
Method 1: Using the Slope and Intercept Functions

- Select the cell where you want to display the slope coefficient (B1)
- Type
=SLOPE(range of y values, range of x values)and press Enter - Select the cell where you want to display the intercept (B0)
- Type
=INTERCEPT(range of y values, range of x values)and press Enter
For example, if your data is in the range A1:B10, the formulas would be:
=SLOPE(B1:B10, A1:A10) for B1
=INTERCEPT(B1:B10, A1:A10) for B0
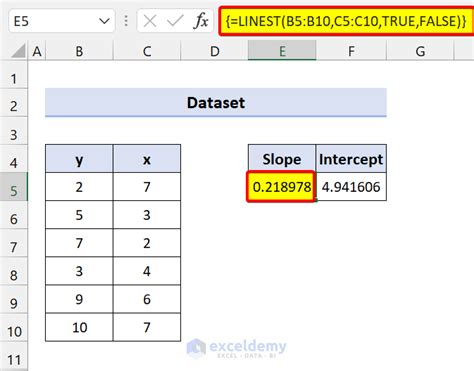
Method 2: Using the LINEST Function
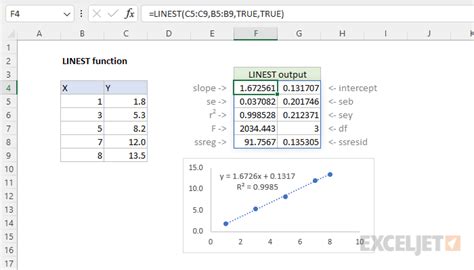
- Select the cell where you want to display the slope coefficient (B1) and intercept (B0)
- Type
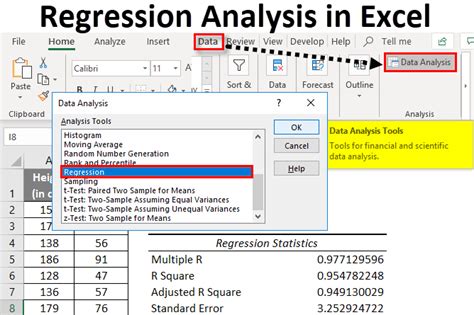
=LINEST(range of y values, range of x values)and press Enter - This will return an array of values, including the slope coefficient (B1) and intercept (B0)
For example, if your data is in the range A1:B10, the formula would be:
=LINEST(B1:B10, A1:A10)
Interpreting the Results
Once you've calculated B1 and B0, you can interpret the results:
- B1 represents the change in the dependent variable for a one-unit change in the independent variable. A positive value indicates a direct relationship, while a negative value indicates an inverse relationship.
- B0 represents the intercept or constant term. This value represents the expected value of the dependent variable when the independent variable is equal to zero.
Tips and Variations
- To calculate B1 and B0 for multiple independent variables, use the
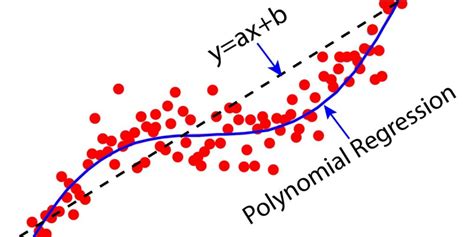
LINESTfunction with multiple ranges of x values. - To calculate B1 and B0 for a polynomial regression, use the
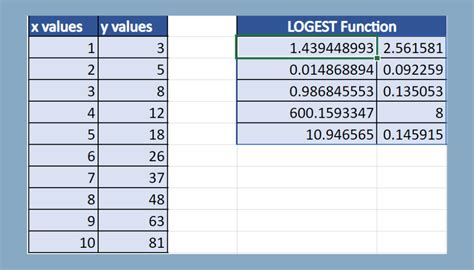
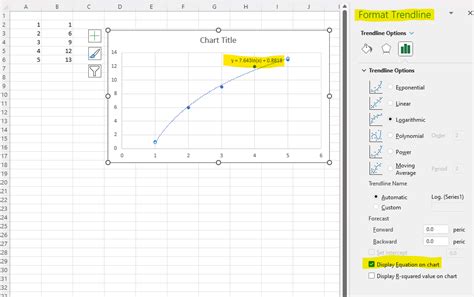
LOGESTfunction. - To calculate B1 and B0 for a logarithmic regression, use the
LOGESTfunction.
Gallery of Calculating B1 and B0
Calculating B1 and B0 Image Gallery



Frequently Asked Questions
- What is the difference between the slope and intercept?
- How do I calculate B1 and B0 for multiple independent variables?
- Can I use the
LINESTfunction for polynomial regression?
Stay Ahead with Calculating B1 and B0
Calculating B1 and B0 in Excel is a fundamental concept in linear regression analysis. By following the step-by-step process outlined in this article, you'll be able to calculate these values with ease. Remember to interpret the results correctly and use the tips and variations to expand your analysis.
Share Your Thoughts
Have you used the SLOPE and INTERCEPT functions or the LINEST function to calculate B1 and B0 in Excel? Share your experiences and tips in the comments below.
