
One-way ANOVA (Analysis of Variance) is a statistical technique used to compare the means of two or more groups to determine if there is a significant difference between them. Excel provides a built-in tool to perform one-way ANOVA, making it easier to analyze data. In this article, we will walk you through a step-by-step guide on how to perform one-way ANOVA in Excel.

Understanding One-way ANOVA
Before we dive into the steps, let's understand the basics of one-way ANOVA. One-way ANOVA is used to compare the means of two or more groups to determine if there is a significant difference between them. The technique is called "one-way" because we are only comparing the groups based on one factor.
When to Use One-way ANOVA
One-way ANOVA is commonly used in various fields, including business, medicine, and social sciences. It is used to answer questions such as:
- Is there a significant difference in the mean scores of students from different schools?
- Does the mean weight of patients differ significantly between different treatment groups?
- Is there a significant difference in the mean salary of employees from different departments?
Performing One-way ANOVA in Excel
To perform one-way ANOVA in Excel, follow these steps:
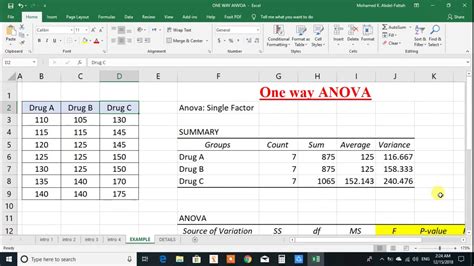
Step 1: Prepare Your Data
- Enter your data into an Excel spreadsheet. Each group should be in a separate column.
- Make sure the data is organized in a way that allows you to easily identify the different groups.
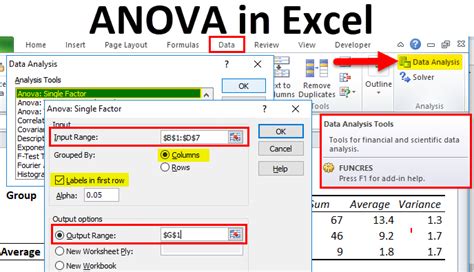
Step 2: Go to the Data Analysis Tool
- Click on the "Data" tab in the Excel ribbon.
- Click on "Data Analysis" in the Analysis group.
- If you don't see the Data Analysis button, you need to activate the Analysis ToolPak add-in.
Step 3: Select the ANOVA Tool
- In the Data Analysis dialog box, select "Anova: Single Factor" and click "OK".
Step 4: Select the Input Range
- In the Anova: Single Factor dialog box, select the input range.
- The input range should include the data for all groups.
Step 5: Select the Grouping Variable
- Select the column that contains the grouping variable.
- The grouping variable is the variable that defines the different groups.
Step 6: Choose the Output Options
- Choose the output options, such as the output range and the level of significance.
Interpreting the Results
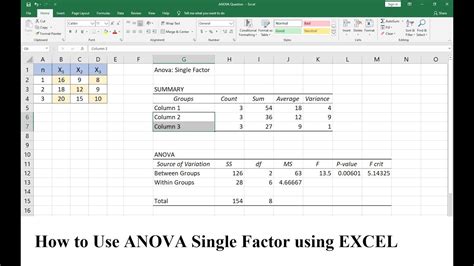
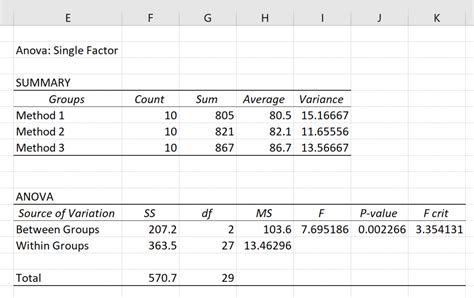
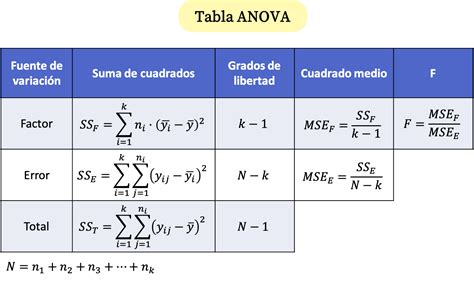
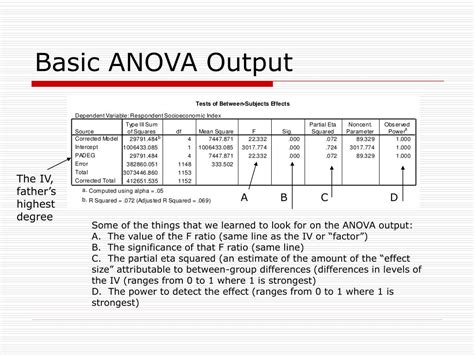
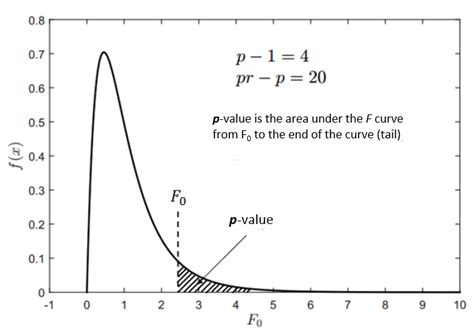
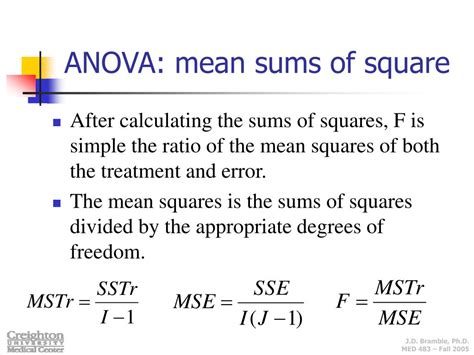
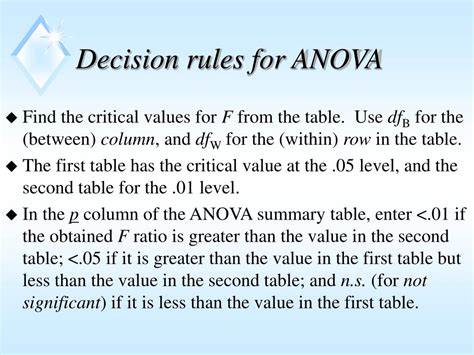
The output of the one-way ANOVA test includes several statistics, including the F-statistic, the p-value, and the mean square. The F-statistic is a measure of the variance between groups relative to the variance within groups. The p-value is the probability of observing the F-statistic under the null hypothesis that the means are equal.
Decision Rules
- If the p-value is less than the level of significance (usually 0.05), reject the null hypothesis and conclude that there is a significant difference between the means.
- If the p-value is greater than the level of significance, fail to reject the null hypothesis and conclude that there is no significant difference between the means.
Gallery of ANOVA in Excel
ANOVA in Excel Image Gallery


Conclusion
In conclusion, one-way ANOVA is a powerful statistical technique used to compare the means of two or more groups. Excel provides a built-in tool to perform one-way ANOVA, making it easier to analyze data. By following the steps outlined in this article, you can easily perform one-way ANOVA in Excel and make informed decisions based on your data.
We hope this article has been helpful in guiding you through the process of performing one-way ANOVA in Excel. If you have any questions or need further clarification, please don't hesitate to ask. Share your thoughts and experiences in the comments below!