What is Z Score and Its Importance in Data Analysis
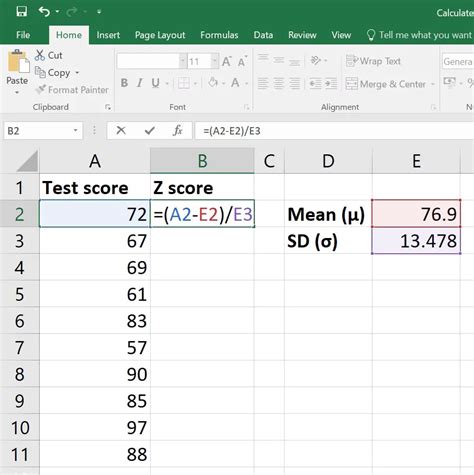
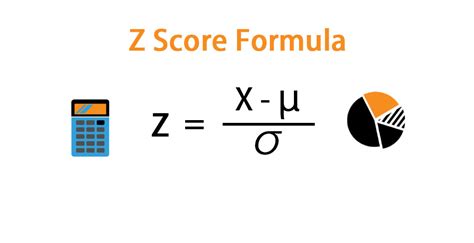
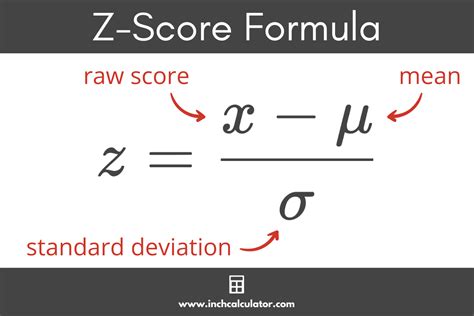
In statistics, a Z score is a measure of how many standard deviations an element is from the mean. It's a crucial concept in data analysis, as it helps to understand the distribution of data and identify patterns or outliers. The Z score is also known as the standard score, and it's calculated by subtracting the mean from the data point and dividing the result by the standard deviation.
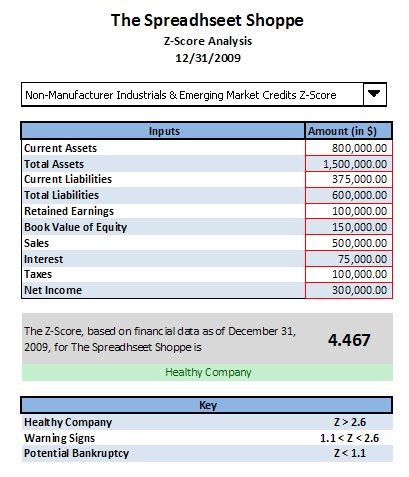
The Z score is essential in various fields, such as finance, medicine, and social sciences, where it's used to compare data points and make informed decisions. For instance, in finance, the Z score can be used to evaluate the creditworthiness of a company or an individual. In medicine, it can be used to diagnose diseases or evaluate the effectiveness of treatments.
How to Calculate Z Score in Excel
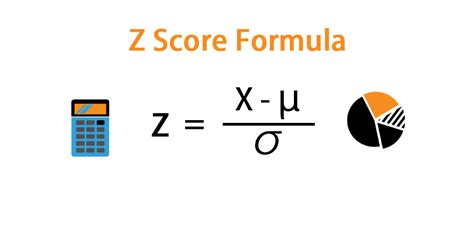
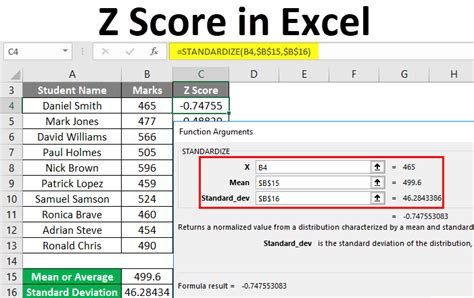
Calculating the Z score in Excel is a straightforward process. You can use the following formula:
Z = (X - μ) / σ
Where:
- Z is the Z score
- X is the data point
- μ is the mean
- σ is the standard deviation
You can use the AVERAGE function to calculate the mean and the STDEV function to calculate the standard deviation.
Here's an example of how to calculate the Z score in Excel:
Suppose you have a dataset of exam scores, and you want to calculate the Z score for each score.
| Score |
|---|
| 80 |
| 70 |
| 90 |
| 85 |
| 75 |
To calculate the mean, use the AVERAGE function:
=AVERAGE(A1:A5)
To calculate the standard deviation, use the STDEV function:
=STDEV(A1:A5)
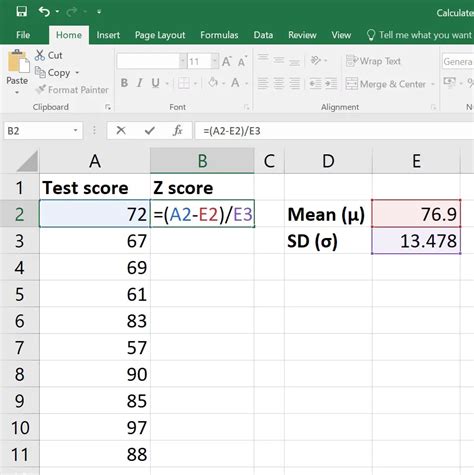
Once you have the mean and standard deviation, you can calculate the Z score using the formula:
=(A1-AVERAGE(A$1:A$5))/STDEV(A$1:A$5)
Drag the formula down to apply it to all the scores.
Using Z Score Calculator in Excel: A Step-by-Step Guide
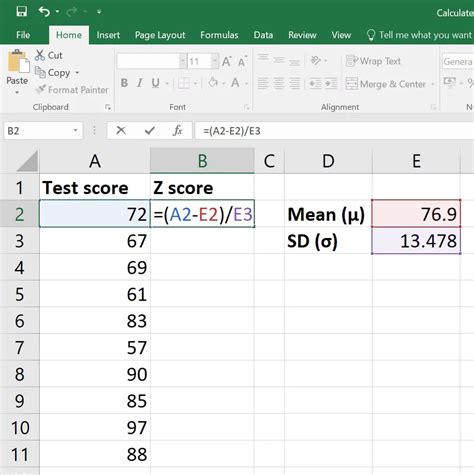
Using a Z score calculator in Excel can simplify the process of calculating Z scores for large datasets. Here's a step-by-step guide on how to use a Z score calculator in Excel:
- Create a table with your data: Enter your data into a table in Excel.
- Create a column for the Z score: Create a new column next to your data and label it as "Z Score".
- Enter the Z score formula: Enter the Z score formula in the first cell of the Z score column.
- Drag the formula down: Drag the formula down to apply it to all the data points.
- Format the Z score column: Format the Z score column to display the Z scores with the desired number of decimal places.
Here's an example of a Z score calculator in Excel:
| Score | Z Score |
|---|---|
| 80 | =(A2-AVERAGE(A$2:A$6))/STDEV(A$2:A$6) |
| 70 | =(A3-AVERAGE(A$2:A$6))/STDEV(A$2:A$6) |
| 90 | =(A4-AVERAGE(A$2:A$6))/STDEV(A$2:A$6) |
| 85 | =(A5-AVERAGE(A$2:A$6))/STDEV(A$2:A$6) |
| 75 | =(A6-AVERAGE(A$2:A$6))/STDEV(A$2:A$6) |
Interpreting Z Scores
Interpreting Z scores is crucial in understanding the distribution of data. Here are some general guidelines for interpreting Z scores:
- A Z score of 0 indicates that the data point is equal to the mean.
- A positive Z score indicates that the data point is above the mean.
- A negative Z score indicates that the data point is below the mean.
- A Z score greater than 2 or less than -2 indicates that the data point is more than 2 standard deviations away from the mean.
For example, if a student scored 90 on an exam, and the mean score is 80 with a standard deviation of 5, the Z score would be:
Z = (90 - 80) / 5 = 2
This means that the student's score is 2 standard deviations above the mean.
Common Applications of Z Score Calculator in Excel
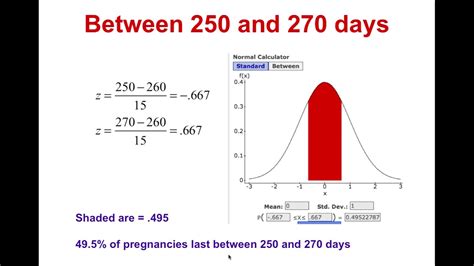
The Z score calculator in Excel has numerous applications in various fields. Here are some common applications:
- Finance: Z scores can be used to evaluate the creditworthiness of a company or an individual.
- Medicine: Z scores can be used to diagnose diseases or evaluate the effectiveness of treatments.
- Social sciences: Z scores can be used to analyze data in social sciences, such as understanding population trends or evaluating the effectiveness of social programs.
- Marketing: Z scores can be used to analyze customer data and identify patterns or trends.
- Quality control: Z scores can be used to evaluate the quality of products or services.
Advantages of Using Z Score Calculator in Excel
Using a Z score calculator in Excel has several advantages:
- Simplifies data analysis: The Z score calculator simplifies the process of calculating Z scores for large datasets.
- Accurate results: The Z score calculator provides accurate results, eliminating errors associated with manual calculations.
- Time-saving: The Z score calculator saves time, allowing you to focus on interpreting the results rather than calculating them.
- Easy to use: The Z score calculator is easy to use, even for those without extensive knowledge of statistics.
Z Score Calculator in Excel Image Gallery
Conclusion
In conclusion, the Z score calculator in Excel is a powerful tool for simplifying data analysis. By using the Z score calculator, you can quickly and accurately calculate Z scores for large datasets, making it easier to understand the distribution of data and identify patterns or trends. Whether you're a student, researcher, or professional, the Z score calculator in Excel is an essential tool for anyone working with data.
We hope this article has provided you with a comprehensive understanding of the Z score calculator in Excel. If you have any questions or need further clarification, please don't hesitate to comment below.
